
BC Child Women Ratios well below average.
What's going on with current BC's demographic trends?
Did BC attract more elderly, families, people of working age 20 to 44 years old?
What's going on with current demographic trends?
Correction: During my testimony at the National Citizens' Inquiry, I meant to say 'Infectious Fatality Rates' not 'Case Fatality Rates'...
How the authors of the British Columbia Center of Disease Control (BC CDC) Situation Reports, regarding the state of emergency declared on March 18, 2020, misrepresented the counts of Covid-19 deaths.
Do charlatans / fraudsters have the right to determine who is 'essential' and who is 'not-essential'?The Declarations of a Public Health Emergency followed the next day by a State of Emergency in BC (declared March 17 and 18, 2020 respectively) were designed mostly to support people in positions of government authority by taking advantage of peoples' good will.
Cover letter to National Citizens' Inquiry
The total population data from the 2021 Census of Population, released in February earlier this year, showed the total population increased higher than the highest growth scenario calculated directly from the the Census counts from 1996 to 2016. The number of people 20 to 29 year olds doubled compared to the previous census period.
Which age groups increased the most?
This article examines government data produced by Statistics Canada: 1) to see if the number of deaths increased above normal variation in 2020, in Canada compared to previous years and 2) whether the number of deaths in 2021 were back to normal - within the highest and lowest numbers from the years prior to 2021. In other words, did the number of deaths in 2020 and 2021 increase or decrease above or below normal variation since 2000, or fall within normal/previous variation?

BC's population increased by more than 300,000 people according to the 2021 Census of Population, above the Highest growth and Highest fertility (CWR) projections calculated, in 2017, directly from the 1996 to 2016 censuses.

Recommendation: All Covid restrictions including maskings children, cease and desist immediately. For details with charts, map and tables see Appendix - 5 pages Refined: April 21, 2022

13 deaths, median age 87 years of age, 90%+ with life threatening ailments doesn't justify Provincial Government of British Columbia Minister of Public Safety, Mike Farnworth's declaration of a State of Emergency. Examination of the data in BC CDC 'Situation Report' March 23, 2020 (Appendix) - 5 pages Refined: April 21, 2022


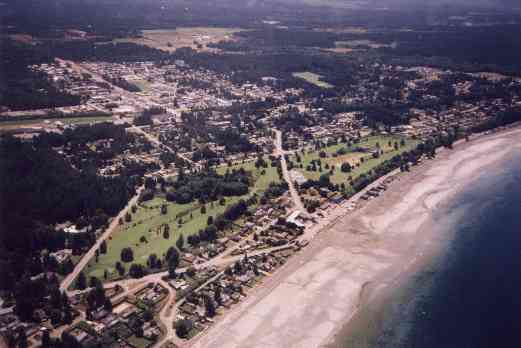
Nestled in the northeast corner of Vancouver, with the transcanada highway on the eastern boundary carrying thousands of vehicles daily over the Burrard Inlet on the Ironworker's Memorial Bridge, this neighborhood surrounding the Pacific National Exhibition did not share in Vancouver's population growth over the last decade and a half concealing a fundamental demographic shift. What demographic shift?

Age Distribution; Population Signature; Age Sex Distribution; Total Population; Dependency Ratios

What will the Age Distributions look like for the next censuses yet to come? Are we in for a smooth ride or a rough ride?

The number of Elders (65+) surpasses the number of children (under 15 years of age) as Chilliwack's Dependency Ratio rises above the Canadian average.

While teen and early 20 year old females had the highest ratio to young children in 1996, by 2016 the highest ratios shifted to the 20 to 24 and the 25 to 29 female year age groups. Only the 30 to 34 year old female age group had a decline in child women ratios between 2011 and 2016. What about the other age groups?

Chilliwack's population increase slowed substantially during the most recent census period (2011 to 2016). Which age groups had the biggest changes?

Let's see if the 2016 census age distribution fell within the range of the highest and lowest trends reflected in the 1996 to 2011 census.

How does the slower than average growth impact the total population projection to 2046?

Capital Regional District population growth highest in 20 years. Which age groups had the largest increases?

Nanaimo Area F, inland from the Parksville Census Agglomeration had an unexpected demographic shift

Golden's total population increased between 1996 and 2001, unlike most municipalities across Canada. Nonetheless, total population will decline even if the strongest growth over the last 20 years were to continue for the next 20 years.

Relatively large increase in 25 to 34 year olds but Child Women Ratios stay low.

Elders move out of single detached houses, help to increase supply. Let's take a look.

Attractive to tree planters and out door recreation enthusiasts, the Village of Cumberland attracts young adults but what's happening with the number of chidren? Let's take a look.

Resource extraction varies in responce to rising and falling prices. Has the transition from raw material exports to tourism and accomodation impacted demographic trends? Let's take a look.

After the 1996 to 2001 decline, the total population has continued to increase. The area is attractive to families and retirees. But is this enough to compensate for out-migration and mortality? Let's take a look.

To find the end of the rise of the boomers, look at Canada's oldest census agglomeration in terms of median age). The Parksville Census Agglomeration 1996 to 2016 Age Distribution with 2021, 2026 Scenarios reveals The End of the Rise of the Boomers

If Current Demographic Trends Continue, Nanaimo Regional District Is In For A Big Change. What will the Nanaimo Regional District age distribution look like in 2021 if current demographic trends continue?

Comparing the 2016 High, Average, and Low Scenarios with the 2016 Census of Population counts by age for the Nanaimo Regional District. Let's take a look at Nanaimo Regional District Attracts Families.

Comparing the 2016 Population Projection Scenarios with the 2016 Census of Population counts by the number of people by age. Let's take a look at Canada's changing migration patterns. Also available as a .pdf.

You thought that the baby boom was bad - a tsunami leaving a trail of demographic destruction. Wait 'til you see British Columbia's next wave of retirees.

Fertility, for Canada in 2011, rebounded from the lows in 2001 and 2006 to near the 1996 level. Did this upward trend continue?

The Population Projections Project methods and data have proven to be a valuable source of demographic information not only at the national level, but also to the provincial/territorial level. Let's take a look at the changing age distribution for British Columbia.

The Population Projections Project methods and data have proven to be a valuable source of demographic information not only at the national level, but also to the local level. Let's take a look at the oldest town (in terms of median age) in Canada as it is a harbinger of things to come for the rest of the nation.

...and what about the forecast for 2036 compared to the Population Projection project's scenarios?Let's take a look.

How do the population projection scenarios calculated directly from the previous (1996 to 2011) censuses compare to the actual 2016 census count for the Nanaimo Regional District. Let's take a look.

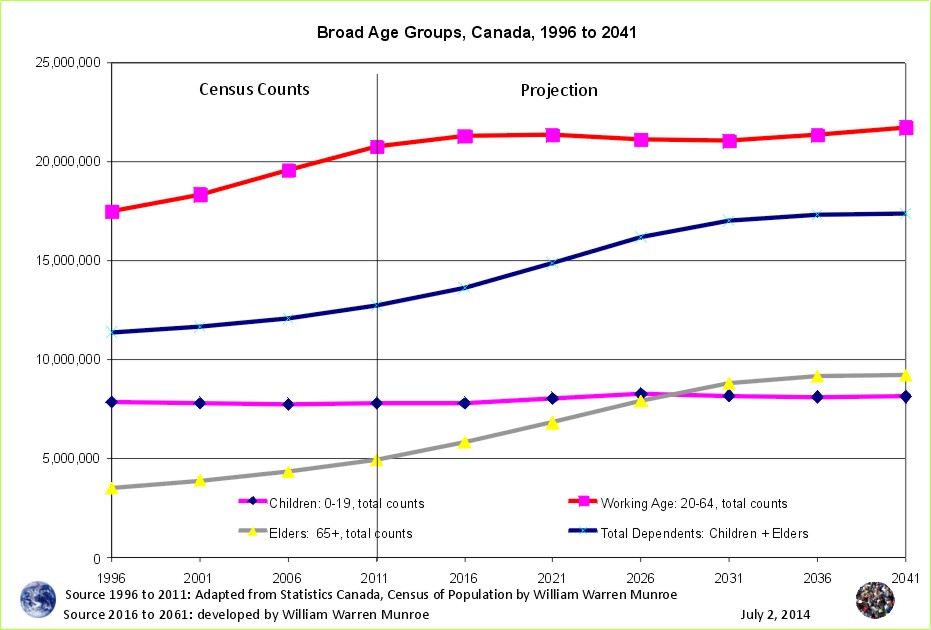
Over the next 20 years (to 2036) there will be twice as many people 65 years of age and over compared to the number of people of working age if current demographic trends continue. Let's take a look.

The rapid increase in the number of people 65 years of age and older in the "Demographic Tsunami Epicentre: Greater Vancouver Regional District" (August 2015) should result in more out-migration to surrounding areas. But is the rising number of people 65 and over in the GVRD matching the number of people 65 and over in the Parksville and Qualicum Beach area? Let's take a look at the Parksville/Qualicum area.

The International Monetary Fund tells Canadians their economy is hobbled by an aging population and sets new standards for information gathering (surveillance) and dissemination. Will Canadians by better or worse off following the IMF? Let's take a look at the IMF's fundamental misunderstanding of Canada's changing population.

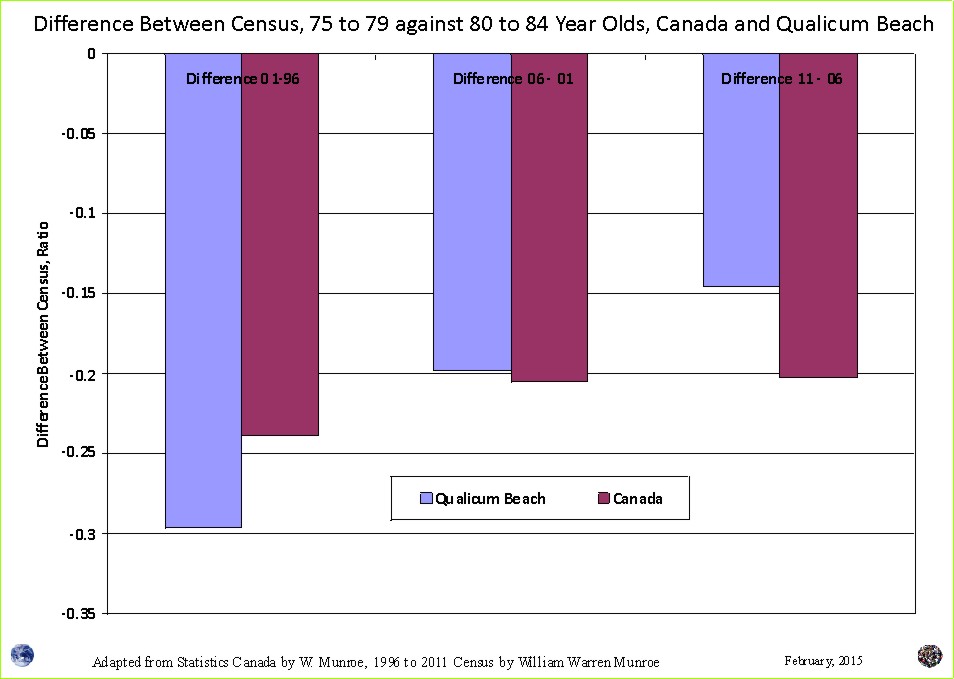
As is often the case, small, little, or no change in total population may hide large changes within. For example, the number of elderly may rise rapidly and the number of people of working age may decline while the total population may not change at all. Let's take a look at Qualicum Beach dependency ratios.

Qualicum Beach has the oldest population in terms of median age of any municipality in Canada. While attractive to both the elderly and to families, (the 20 year olds are out of here), population projections scenarios calculated directly from the censuses of population since 1996 show a wide range of possible futures. Let's take a look.

Although the total population projection average scenario is almost exactly the same as the actual census count for Parksville Census Agglomeration (Oceanside) - less than 1% difference, there are differences for the five year age groups. Let's take a look.

Population projections are thought to be most accurate for large population areas, and less accurate, even unreliable for small population areas such as the Parksville Census Agglomeration - the oldest median age in Canada. Let's see.

"Canada�s latest baby boom caught experts by surprise" was the title of an article in the National Post, July 4, 2014, printed more than 2 years after this trend was revealed in Canada�s 2011 Census of Population and Dwelling, Age Sex released May 28, 2012. With the 2016 Census available, will demographic shifts catch experts by surprise again?

Canada's age distribution continues to change making planning public service at least difficult. Fortunately there are dedicated Population Analysts who make an effort to understand where we are and where we are heading on current demographic trends. But are they doing a good job or are they just misleading us? Let's check.

In Canada, the number of people by their age varies considerably. These fluctuations make planning difficult. Who are you going to call? Population Analysts?
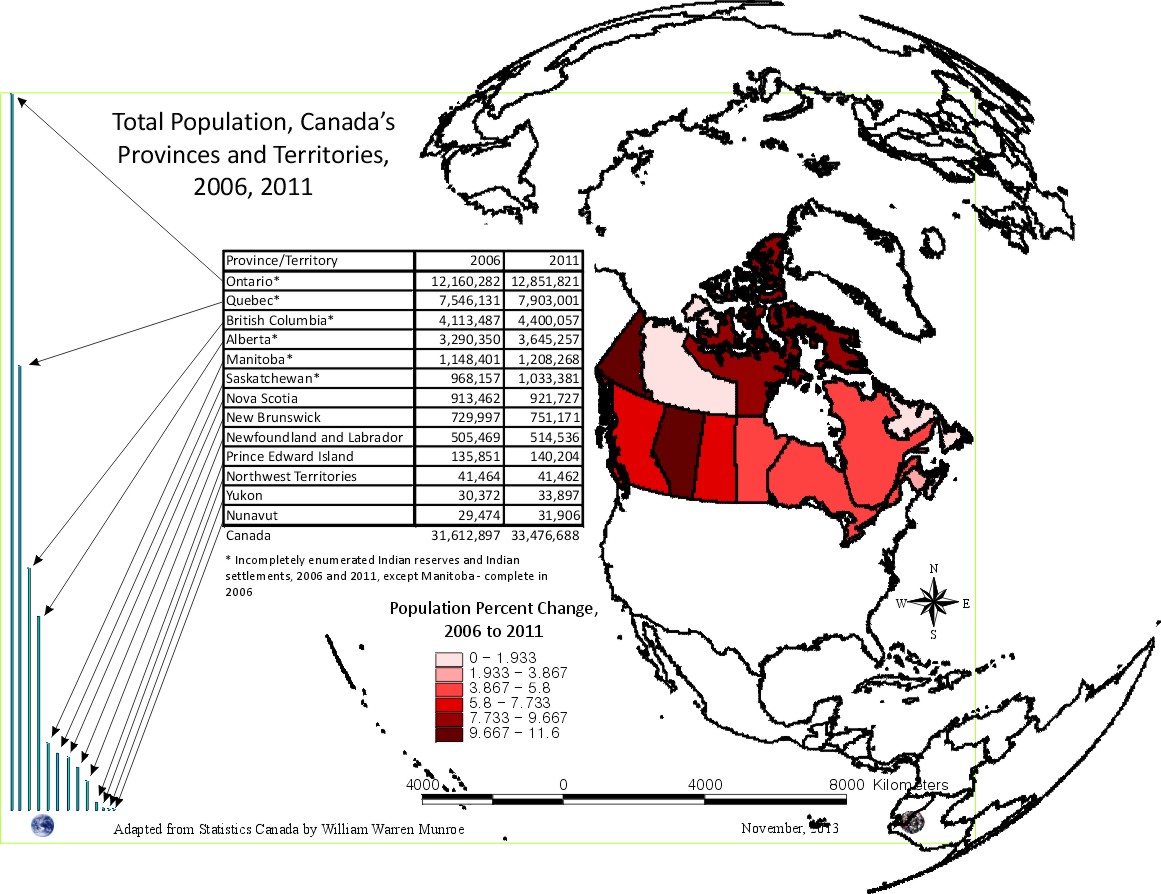
Canada's population increased by 5% between 2011 and 2016, but there was considerable variation between the Provinces and Territories. Let's take a look.

While serving as a BC Government Population Analyst, I wrote a paper describing the reason that BC Stats' post census population estimates were so wrong compared to the census counts. It was in part because the data being used (electrical and telephone landline hookups) were not seeing the rapid growth in the number of people per household in Surrey. Is Surrey still growing strong? Let's take a look.

In early February 2008, at a meeting with local developers (coastal British Columbia), I was asked "when will the next economic downturn begin". "We are already in it" I replied. "When will it end then? "2015 give or take a year". The question now is what will the upturn look like? Let's take a look.

With so many successes, surely some mistakes must have been made. Yes, in January 2008, I said that due to the rapidly rising number of deaths in Qualicum Beach, the population was already going down. But this was a mistake. Fortunately, this revealed an important trend. What happened and what was done?

The population growth between 2011 and 2016 was marginally higher than the highest growth scenario calculated by the Population Projections Project. Let's take a look.

BC's population growth between 2011 and 2016 was marginally higher than the average over the previous fifteen years. Let's take a look.

Not only did the School District 69 (Qualicum) administration withhold the methods and data that should have accompanied the lowered enrolment forecast used to justify public elementary school closures, but the provincial government�s Official Statistical Agency, BC Statistics, did this as well, for over a decade. Letter to the Editor

Although one of the Population Projections Project (PPP) scenarios was almost exactly the same as Canada's 2016 Census of Population result, the PPP is more about understanding where we are and where we are heading on current demographic trends than pretending to foretell the future. Let's take another look. Watch the video.

The 2016 Census of Population counts for Canada as a whole came in at just over 35 million people. How does this result compare with the Population Projections Project's (PPP) 5 possible population projection scenarios calculated directly from Canada's 1996, 2001, 2006, and 2011 Censuses of Population for Canada? Let's take a look.
My requests for the methods and data used to create the new (lower) enrolment forecast elicited this reply: "Any attempt to imply a grassy knoll conspiracy theory is disrespectful.." (Superintendent of School R. Koop implied). Let's take a look at why 4 of 15 schools were closed just as enrolment was going up again.

The number of children under 5 years of age relative to the number of females of child bearing age (Child Woman Ratio - CWR) is changing. Let's take a look.

Could the Provincial Government of British Columbia endorse introducing secondary school teachers and students to current national to local demographic trends calculated from the Census of Population counts as part of the Grade 11 social studies course, demography unit? Letter to MLA Stilwell No reply to date.

Watch for changes in fertility, life expectancy, and migration. Download a table of Canada's Census of Population counts over the last 20 years. Follow the instructions to calculate several projection scenarios for 2016. Create a Table of Discovery for your area (Province/Territory, region, city, town village or census tract). Compare your areas scenarios with the actual 2016 census counts when they come out February 2017.


To shine a light on where we are and where we are heading on current demographic trends the Population Projections Project calculates several population projections scenarios directly from Censuses of Population counts. But the counts miss some people. Let's look at total population trends calculated from Statistics Canada's estimates compared to trends calculated from the Census of Population counts.
Given the remarkable assortment of specialists, the regular recordings of population available through news distribution outlets as well as directly from Statistics Canada�s website, Canadians should be among to the most informed societies in the world - intelligently participating in setting of national priorities. Examples Of Misunderstanding Where Canadians Are And Where Canadians Are Heading On Current Demographic Trends.
Are BC Statistics' method and data of "better quality" than Statistics Canada's? Here's how BC Statistics officials' deceived Statistics Canada.

More children under 5 years old, more females 15 to 44 years of age and the number of young children per females 15 to 44 back up to near 1996 levels.

Population projection scenario less than one percent difference compared to actual census counts for total population and 0 to 4 year olds.

Are males living longer? The proportion of males to females is changing in Canada.

The portion of males and females change at the age of 20 and again at the age of 60. Such is the dance of life in Canada

Whiterock, on the south side of the GVRD, has a very different population signature than Squamish, on the north side of the GVRD. Why is Whiterock attractive to 40 and 50 year olds and teenagers? Why has the number of 75 to 79 year olds dropped by 20% (Canada saw an increase of 5%) while the number of 60 to 64 year olds more than doubled ???

Three of Canada's census areas have been added to the Population Projections Project, namely, Cumberland, BC; Kootenay Central Regional District, BC; and Nelson, BC. Are tree planters moving in or out or what?

Ucluelet and Pangnirtung are similar in that both are in close proximity to National Parks and both host raw resource extraction activity; however, Ucluelet's changing demographic reflects the beginning of a transition from resource extraction to tourism and accommodation. Will Pangnirtung experience an economic as well as social transition?

Since the Baffin Region has a triangular age sex distribution and deaths appear to not visit all 5 year age groups equally (as reflected in the oscillations), we should look at the number of deaths by age and sex. With this we will also be able to calculate, and therefore see more clearly, net migration by age.

Why is the Baffin Region so popular for 25 to 29 year olds?

What are the current demographic trends? In-migration, out-migration, fertility, life expectancy?

Squamish: the Greater Vancouver Regional District's newest bedroom community.

Will the demographic tsunami emanating from the Greater Vancouver Regional District (GVRD) take advantage of the highway improvements out of the north west corner, improvements pushed through to the Squamish-Lillooet Regional District (Census Division)?

Although Sunshine Coast Regional District reaches well within the 100 km radius from the centre of the Greater Vancouver Regional District, the population increase was low between 2006 and 2011 compared to other areas with road access. Let's take a look.

As many energetic, driven, inexperienced young adults as there will be wise, thoughtful, experienced old adults? Let's take a look.

On average, Canadians are living longer than ever before. But will life expectancy continue to increase? Let's take a look.

The geographic epicentre of the demographic tsunami underway on the west coast of Canada is the GVRD where the number of people entering retirement age is increasing by 40% along with increases in the number of young children. Read more.

Fraser Valley RD, Age Distribution, Population Signatures, Age Sex Distribution, Total Population and Dependency Ratios. Here's what they look like.

Hope's dependency ratio (the number of children and elderly relative to 10 people of working age) helps to drag the Fraser Valley Regional District's dependency ratio away from the BC and Canadian average. Here's what they look like.

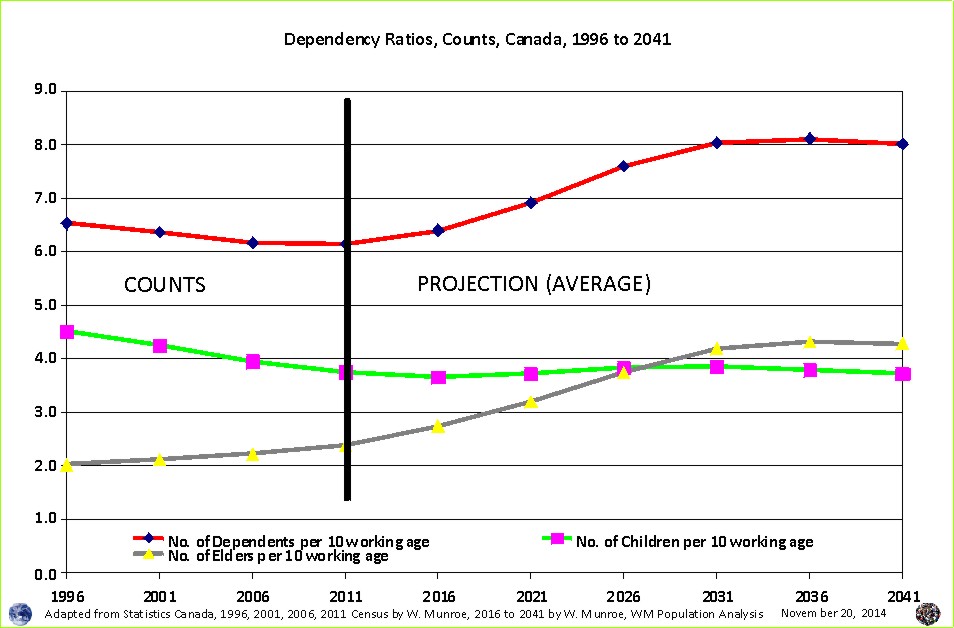
Dependency ratios, Canada, BC, Ft.St. John, and Qualicum Beach, compared.
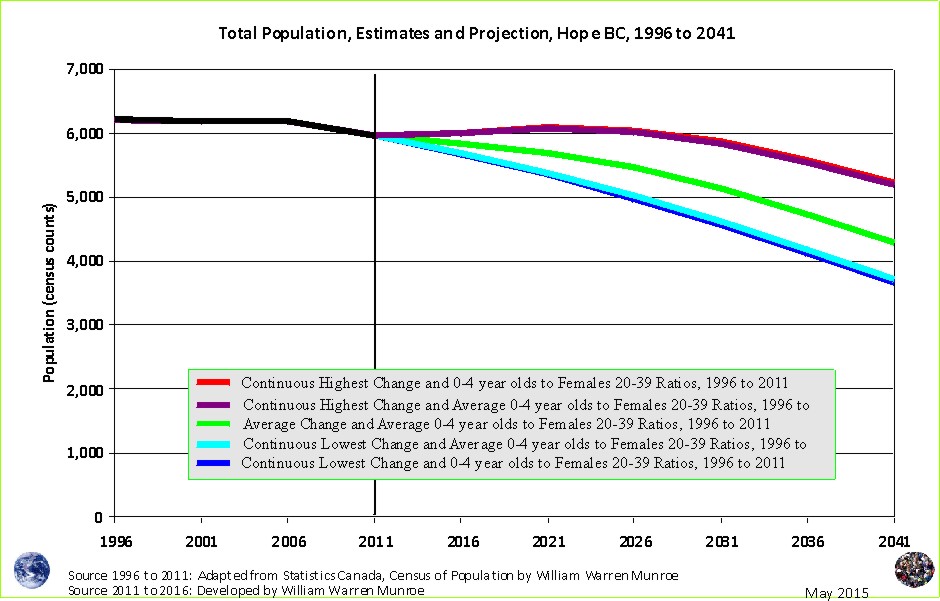
Some retiring baby boomers will move out of high density areas to small towns outside of the high commuter flow areas. With the small town of Hope located at the eastern end of the Fraser valley just 2 hours from Vancouver, will more retirees move in than out? Will the perfect demographic storm reach the coast mountains and what does the future look like?
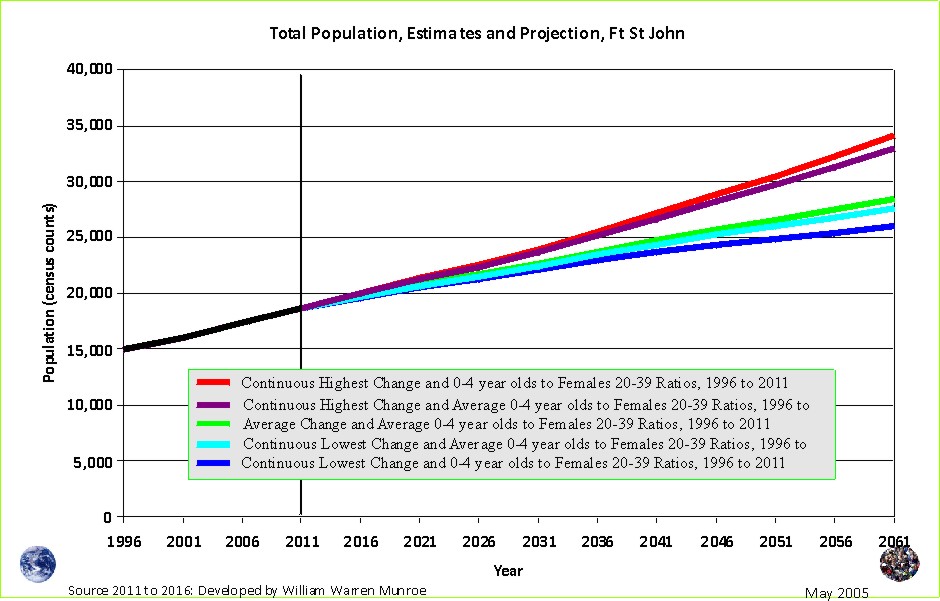
GLOBAL FOSSIL FUEL PRODUCTION increases resulting in declining prices have impacts on the population of producer cities such as Fort Saint John British Columbia. What does the future look like?
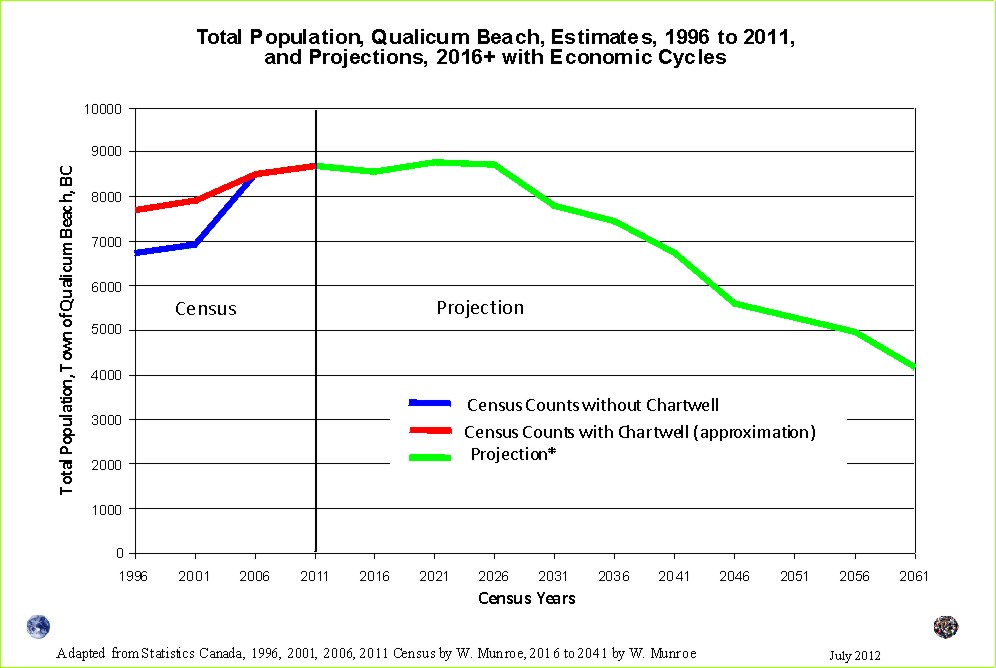
PROVIDING INSIGHT into the future for the rest of Canada is Canada's oldest median age community, Qualicum Beach, like the canary in a coal mine?
In an effort to explain why the Qualicum District's population is forecast to increase by over 30% to the year 2030, the BC Ministry of Health representative suggested longer life expectancy was the reason. Really?
Where will the Baby Boomers move next? And what about young children and their parents. Areas outside of high commuter flows may see an influx of both.
This is an abridged version of the Big Data and the Third Sector Workshop #2 - Why the Population Projection Project was developed?
$10 million expansion plus entire school recommended for permanent closure 7 years after opening; forecast method provided by Official Statistical Agency was not the method used; disclosure of assessment of method denied - disclosure harmful to senior government officials rather than harmful to intergovernmental relations? Big Data and the Third Sector Workshop #2.
We live in the last half of the one hundred year revolution shaped by the transition from above to below replacement fertility.
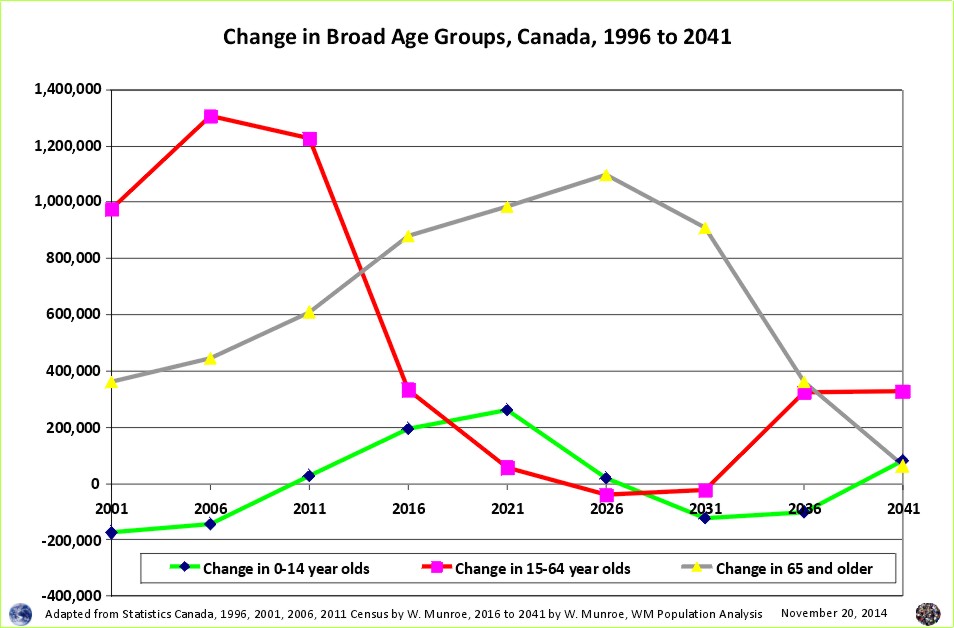
What impacts will there be? Let's take a look at a chart of the recent changes in Canada's broad age groups with the addition of a medium scenario population projection. Read ...


While helping to bring an end to exporting carnage into south east asia, this generation also helped end the population pyramid. Read ...

If current (1996 to 2011) demographic trends continue, the age distribution will continue to oscillate - boom, bust, echo, bust, echo, bust, echo, etc. Read ...
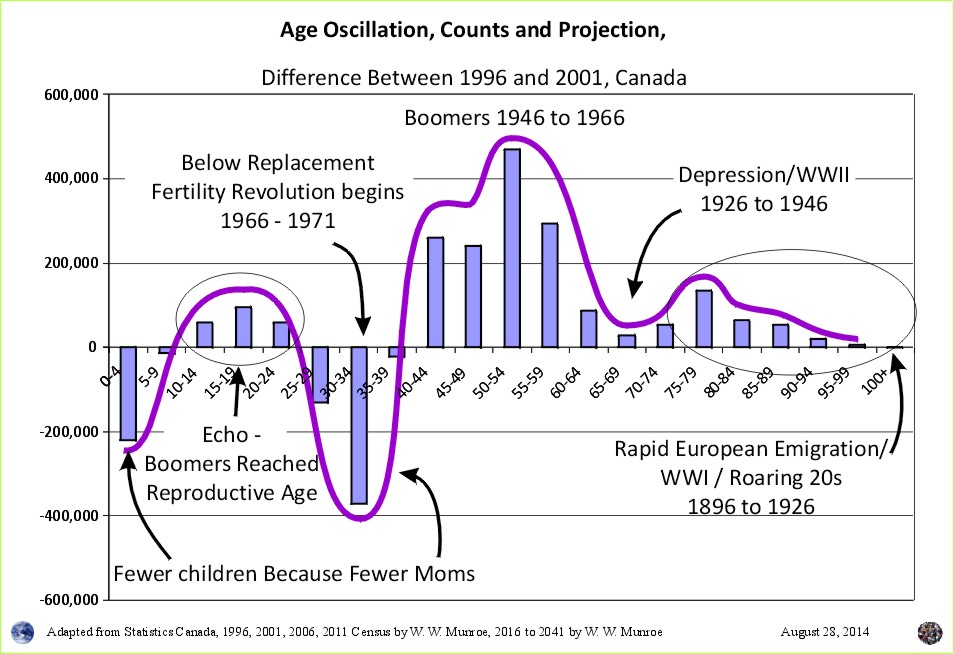
During the last 50 years of the 20th century, a demographic revolution occurred in Canada. The often referred to population pyramid gave way to a very different age/sex distribution begging another title to reflect the reality of the 21st century. Read ...

According to Carleton University professor, Linda Duxbury, "The huge group of baby boomers leaving the labour market is going to have repercussions in every workplace." To make up for the shortfall "we would require 650,000 to 750,000 skilled immigrants of working age every year." Really? Let's check!

With below replacement fertility and the rise of the elders, how does Canada�s age/sex distribution compare to the often referred to population pyramid. Read ...

With below replacement fertility and the rise of the elders, how does Canada�s age/sex distribution compare to the often referred to population pyramid Read ...

Since the number of 0 to 4 year olds counted in 2011 was considerably higher than those in this age group counted in 2006 in BC, we should see the number of those 5 to 9 years of age increase between 2011 and 2016. Let's take a look. Read ...
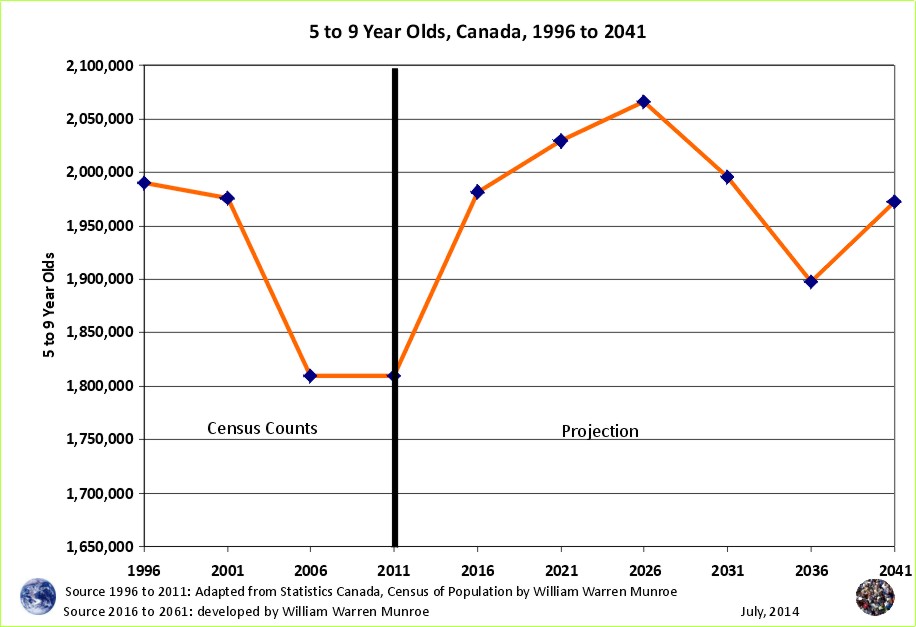
Since the number of 0 to 4 year olds counted in 2011 was considerably higher than those in this age group counted in 2006, we should see the number of those 5 to 9 years of age increase between 2011 and 2016. Let's take a look. Read ....
Now that we have looked at the projection (medium scenario) for young children and seen the numbers fluctuate between 1.7 and 2 million, as well as females 25 to 34 years of age, let's take a look at the impact of the rising of the elderly.
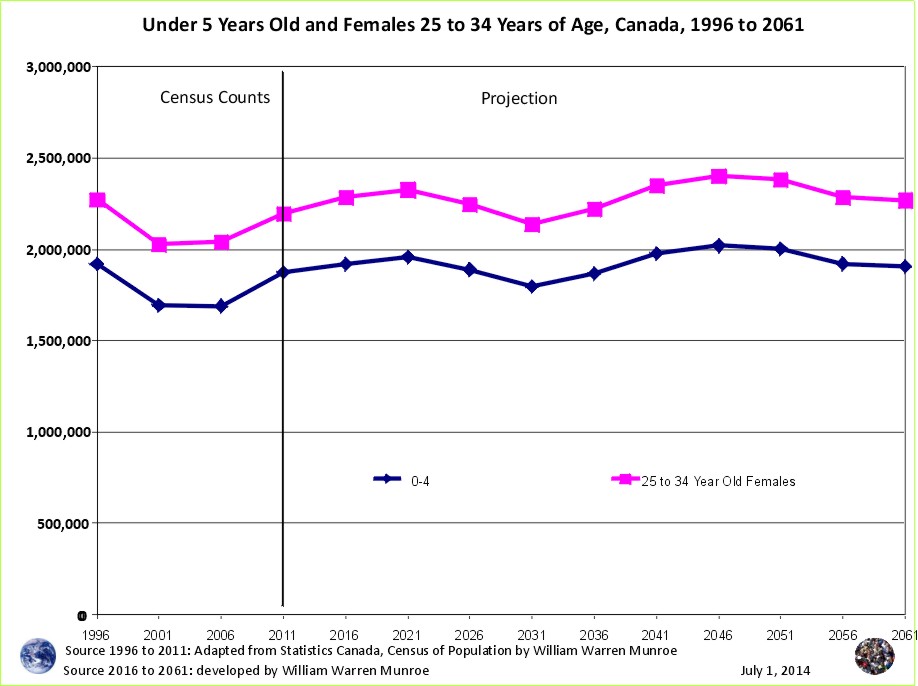
Happy Birthday Canada! Recent demographic trends show that the number of children under 5 years of age declined then rose again between 1996 and 2011. What does the future look like if current trends continue?
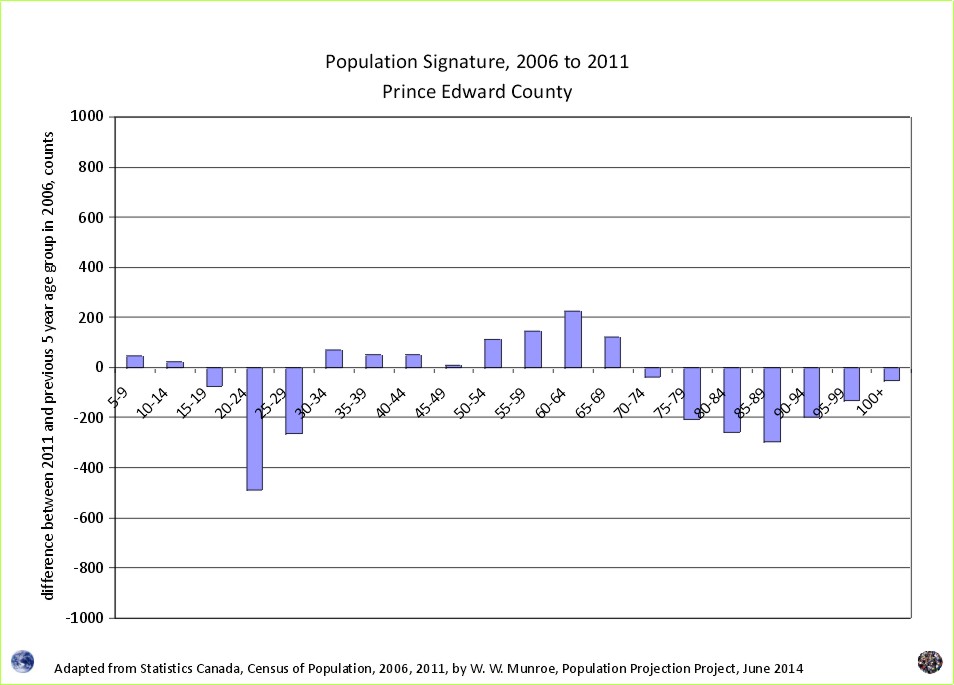
Both areas, Parksville CA and Prince Edward County, are attractive to families and retirees but not to young adults.
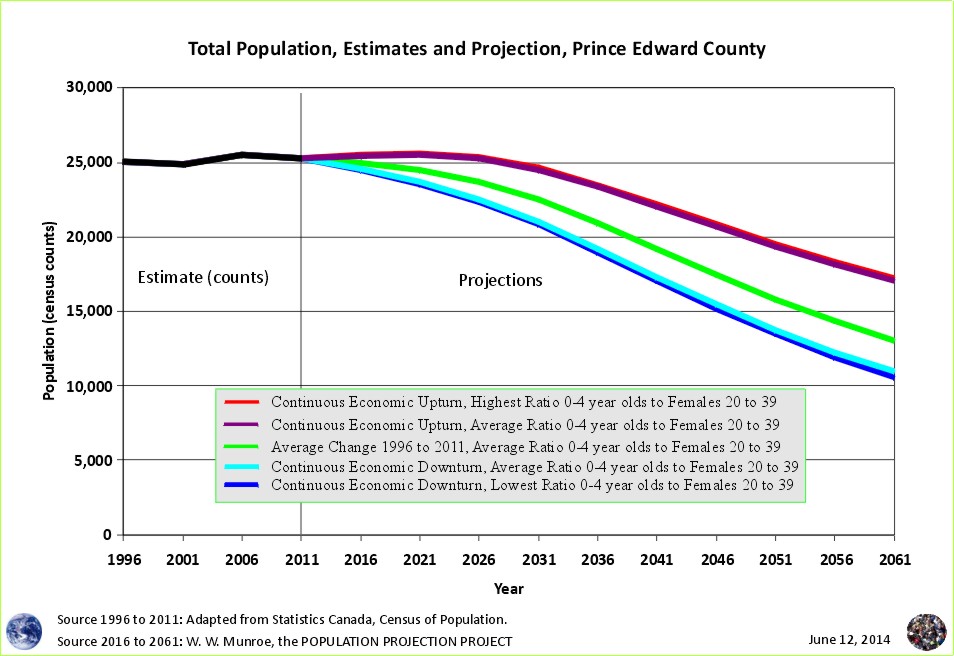
Will there be enough young adults to meet the demands of the rising elderly population? Let's take a look at picturesque Prince Edward County on the north shore of Lake Ontario, outside of the high commuter flows of Toronto, with about the same population size as Canada's oldest community, in terms of median age, the Parksville Census Agglomeration.

What do Alberta and the west coast municipalities of Tofino and Ucluelet have in common? They are attractive to young adults with fewer children resulting in lower numbers of dependents relative to those of working age. But what about the baby boomers retiring?

Two substantial changes between 1996 and 2011: For Ucluelet, children (0 to 19 years of age) decline by ~40%; for Tofino, number of working age (20 to 64) doubled. The result? A brief lowering of the number of dependents relative to those of working age.
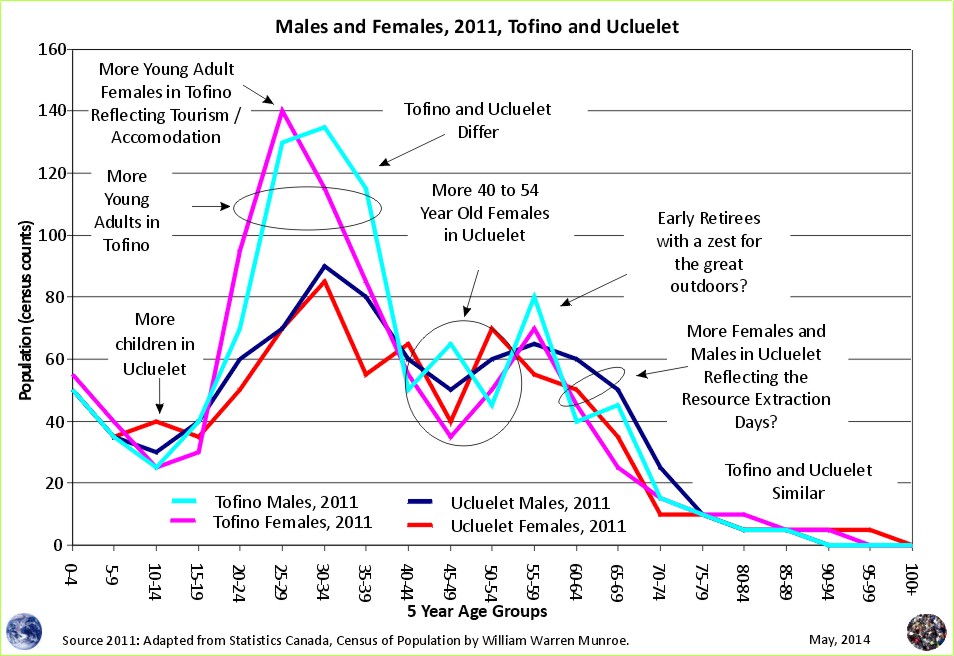
How attractive are Tofino and Ucluelet for males and females by age?

Ucluelet looses population and resource extraction jobs and people from all age groups only to be followed by years of attracting more and more young adults, and children.

For many young adults, small towns are unattractive - 20 to 29 year olds get out of town, rapidly, in favour of education, employment and social opportunities in larger population centers.
Bucking this trend is Tofino, on Canada's West Coast, a small town very attractive to young adults, many moving out of large population centers in favour of living closer to the wild, wide spaces and surfing.
But while the number of females 20 to 39 years of age has doubled from approximately 220 to 435 since 1996, the number of children under 5 rose by approximately 15.

The Qualicum School District's last facility review in 2010-2011 included BC Statistics' false reporting of methods used to create population numbers. The method provided by BC Statistics did not show that BC Statistics used the change in the number of telephone lines as an indicator of population change, nor the many other influences on the final numbers. For this most recent facility review, 2013-2014, methods were simply not provided. Requests for the methods were met with accusations of "conspiracy theorists".
Help safeguard the integrity of population projection numbers used to justify public policy making by insisting on well-defined scenarios based on current demographic trends that can be verified and reproduced.

Recall in 2010, just 7 years and 1 month after opening a $9.1 million expansion in 2003, the Qualicum School District recommended permanently closing the $9.1 million expansion along with the original high school.
Having served as the Population Analyst for BC Statistics from 2002 to 2006, I continue to advocate that correct methods must accompany findings. Be sure to get clear explanations of how forecasts used to justify opening and closing schools are made.

Medical Health Officer for the Qualicum Local Health Area, Dr. Hasselback presented a chart showing a 31% increase in population by the year 2030 - from approximately 46,500 to 61,000 an increase of 14,400 people.
On the other hand, Rollie Koop, Superintendent of the Qualicum School District is prepared to close 4 schools based on a forecast (without providing the reasoning) of 0% increase in persons of school age to the year 2027.

When schools are recommended for closure, a public consultation is required to ensure "a fair consideration of the community�s input and adequate opportunity for the community to respond to a board�s proposal to close the school permanently", as well as to ensure fair consideration of "future enrolment growth in the district of persons of school age, persons of less than school age and adults".
Public consultation participants have a choice, use open transparent, well defined projections.

Newly appointed Superintendent of Schools, Rollie Koop, dismisses requests for the assumptions behind new lower enrolment forecast claiming community members who ask are "disrespectful".

What is the difference between projections and forecasts?
Open, published methods and data used to create well defined scenarios, versus pretending to foretell the future
For projections that are valid (can be validated) use the Population Projection Project.
The Population Projection Project is an open, public reference to be used when considering the future enrolment growth for areas in Canada of persons of school age, persons of less than school age and adults.
Since the Qualicum School District staff and board members are not allowing the public to see the method used to create the new (lower) forecast, be sure to use the Population Projection Project.

Has the enrolment decline bottomed out and is it about to rise again in 2016/17 as forecast in 2010? Or will the enrolment decline more than expected as Baragar foretells?
One way to check is to look at the rate of change in enrolment.
Another way is to look at the enrolment of the students in Kindergarten to grade 5.

Why is the updated forecast lower that the previous forecast?
Why is the updated method not published?
"Forecasting pretends to foretell the future." (Ivan Fellegi, 1999).

Why are Statistics Canada's projections so high compared to the United Nations and the Cohort Change Ratios projections?

What does the Sandwich Generation look like? Starting alphabetically with Alberta.
In an interview with CTV we discussed 1) The importance of caution when using statistics and 2) What is happening with the enrolment in Central Vancouver Island areas.

While the north west coastal regions lose population, the Greater Vancouver Regional District received a disproportional high population increase between 2006 and 2011
The number of people residing in the southern portion of the coast grew from 2.6 million to over 3.2 million between 1996 and 2011.
See BC Coast Census Divisions (Regional Districts) population proportions.

Between 2006 and 2011, Canada experienced population changes from east to west but also from rural to urban.
Yet, the increase in population for Alberta and BC, when added together, was less than the increase for Ontario.

The Penticton CA was less attractive to retirees between 2006 and 2011 with more out-migration and death than in-migration for those 60 to 69 years of age.
The number of those 30 to 45 years of age has dropped by 30% since 1996 while the number of young adults (20 to 29) stayed relatively stable.

Population declines may happen around the year 2026 for much of the census agglomeration. But Qualicum Beach may be experiencing declines earlier. If so, those born this year will be 8 years old when the declines come. What might it be like?
Read about "6 Population Projections for Parksville Census Agglomeration"...

With fertility below replacement (less than 2 children per female), the 'boomers' ageing, and mortality increasing rapidly, why is the BC government population projection 'up and to the right'? Why do BC government interprovincial migration projections scenarios not include negative net migration?
Government population projections for BC reflect an "up and to the right" aspiration, while the cohort change ratios method shows BC's population growth slowing, and levelling out. Read a "A Comparison of Population Projections for BC"...

Declining population is considered by some to be beneficial for "the environment". On the other hand, declines are considered by some to be detrimental to economic activity. Is there a way to maintain or improve quality of life and prosperity as population growth slows, levels out, or declines?
Read ...
Parksville Census Agglomeration is one of the oldest, in terms of median age of residents, regions in Canada. What does the future look like?
While deaths continue to increase and births stay relatively low, below replacement, population can only increase with even more in-migration than out-migration.
Read ...
With deaths exceeding births by nearly 6 times (600%) and rising, will the fluctuating migration keep the town's total population from declining?
Read ...
, for Canada, provinces and territories")


")
")


