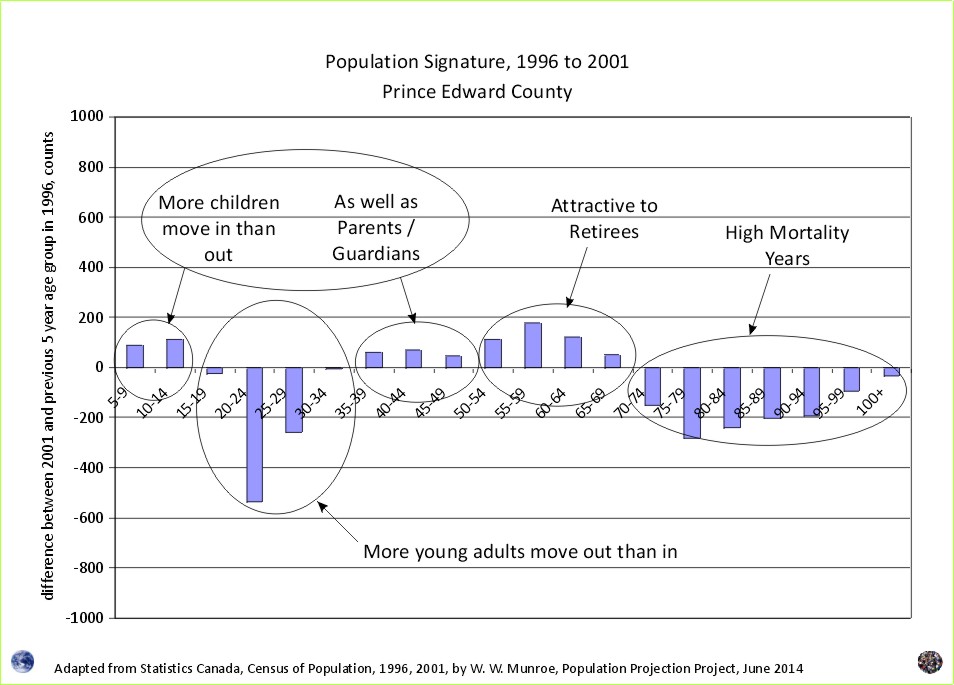
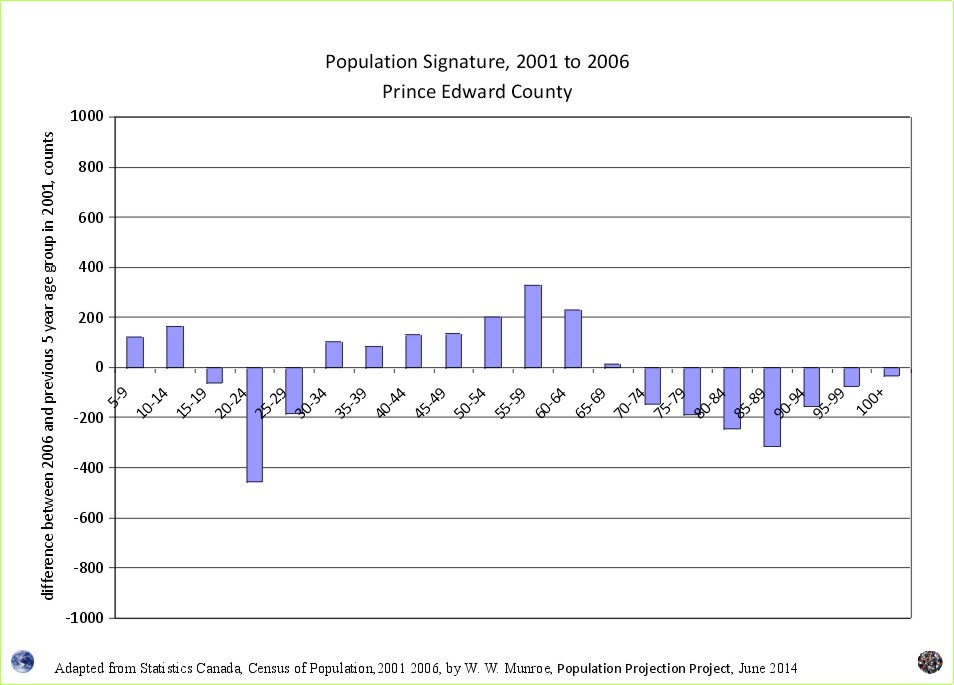
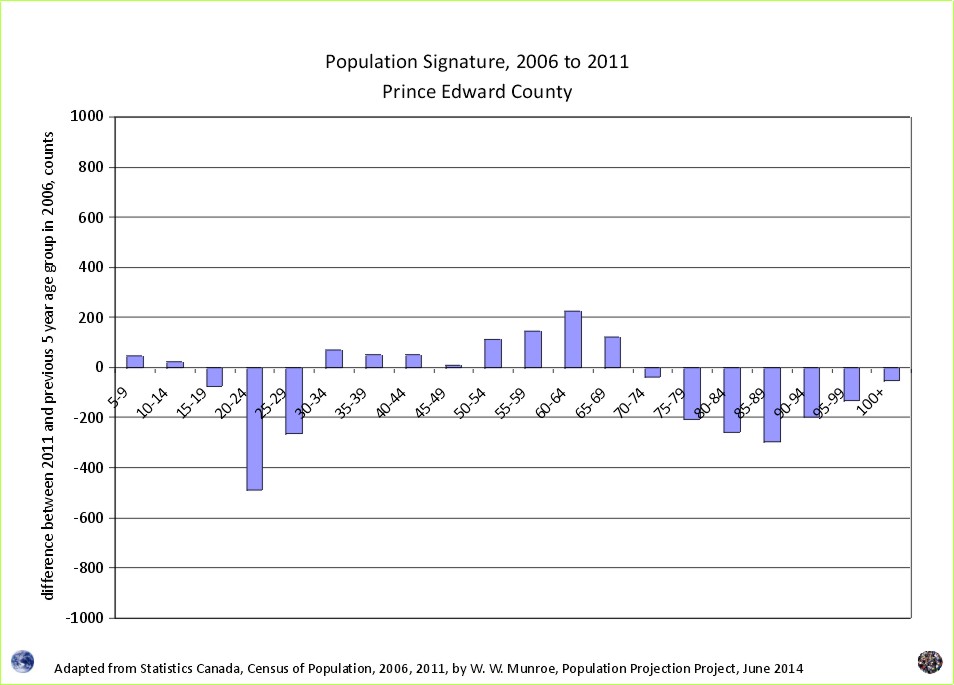
In the previous article, I mentioned there are "fewer young working families (parents and their children)" residing in Prince Edward County; however, this does not mean that PEC is not attractive to families. To see which 5 year age groups had more or less than expected if no one moved nor passed away we look to the population signatures.1


Placing the Population Signatures side by side allows us to see that both areas are attractive to families and retirees but not to young adults. Indeed, both areas lose about the same number of young adults (20 to 29 year olds), with some interesting differences. Many of whom are likely heading to the big city, but some perhaps heading to the west coast (Tofino and Ucluelet).
We can also see that the Parksville area attracts more people 55 to 69 years of age than does Prince Edward County. For example between 2006 and 2011, approximately 700 more 60 to 64 year olds were counted than expected in the Parksville area, while only 200 more were counted in Prince Edward County. Little wonder why the Parksville area has the highest median age in Canada and a projection of a higher number of dependents relative to those of working age.
What do you see?
1 Canadians have arguably the best data set in the world with which to examine the changing age distribution, namely the Census of Population conducted every five years. Why?
a) Because the census is an actual count, and is more reliable for comparisons than estimates. Estimates are constructed by people who may not disclose correctly or accurately how the counts were adjusted to create an estimate. For example, BC Statistics gave false estimate methods and input data to Statistics Canada for an assessment of methods to be used for equalization payments. Indeed, for 10 years (2000 to 2009) without informing anyone, BC Statistics estimated the population of municipalities in BC using the change in the number of telephone lines (even though analysts showed how the increase in cell phone use made this data unreliable, and were fired); therefore, be sure to examine the counts first then the estimates and ensure that the estimates are verifiable and reproducible, if not, don't use them. See Disclosure Of Methods Report Considered Harmful.
b) The Census of Population is public - paid for by all Canadians for the benefit of all Canadians; therefore, the counts are open, rather than closed and controlled by a small group of people in positions of government authority (i.e. BC Statistics), who can falsify numbers with Ministerial acceptance. See the presentation describing BC Statistics real methods made to the 2013 Congress "Methods for Projections" session hosted by the Canadian Population Society.
1996 is the starting point because this was when the Census of Population counts became available on the internet in a form comparable to later years, thus providing an understanding of recent trends.
2Adapted from Statistics Canada, 1996, 2001, 2006, and 2011 Census of Population, by William Warren Munroe
1996 Census: Catalogue Number 95F0181XDB96001.
2001 Census: Catalogue Number 97-551-XCB2006009.
2006 Census: Catalogue Number 97-551-XCB2006009.
2011 Census: Catalogue Number 98-311-XCB2011024.
Referring to the 1996, 2001, 2006, and 2011 census counts well-defined projection scenarios (by five year age groups) can be created. For more information on how to create population projections see the Population Projection Project.
Outdoor Recreation to Family Formation in Tofino and Ucluelet
From Resource Extraction to Tourism and Accommodation - Ucluelet's Changing Demographics
Dependency Swap - From Fewer Children to More Elderly - What does the Sandwich Generation look like?
Population Projections for the Parksville Census Agglomeration
Why are Statistics Canada's projections so high compared to the United Nations and the Cohort Change Ratios projections? Why so different?
Government population projections for BC reflect an "up and to the right" aspiration, while the cohort change ratios method shows BC's population growth slowing, and levelling out. Read a "A Comparison of Population Projections for BC"...