The tremendous demographic changes facing communities across Canada are reflected in the Census of Population.1 But changes in age distribution vary by place, for example Tofino and Ucluelet on the west coast of Vancouver Island attract young adults while on the east coast of Vancouver Island, elders in two of Canada's oldest communities (in terms of median age), Parksville and Qualicum Beach, have been unsuccessful in attracting and retaining 20 to 34 year olds much needed to serve the rising retirement population.
What about other areas attractive to retirees? Will there be enough young adults to meet the demands of the rising elderly population? Let's take a look at picturesque Prince Edward County on the north shore of Lake Ontario, outside of the high commuter flows of Toronto, with about the same population size as the Parksville Census Agglomeration.

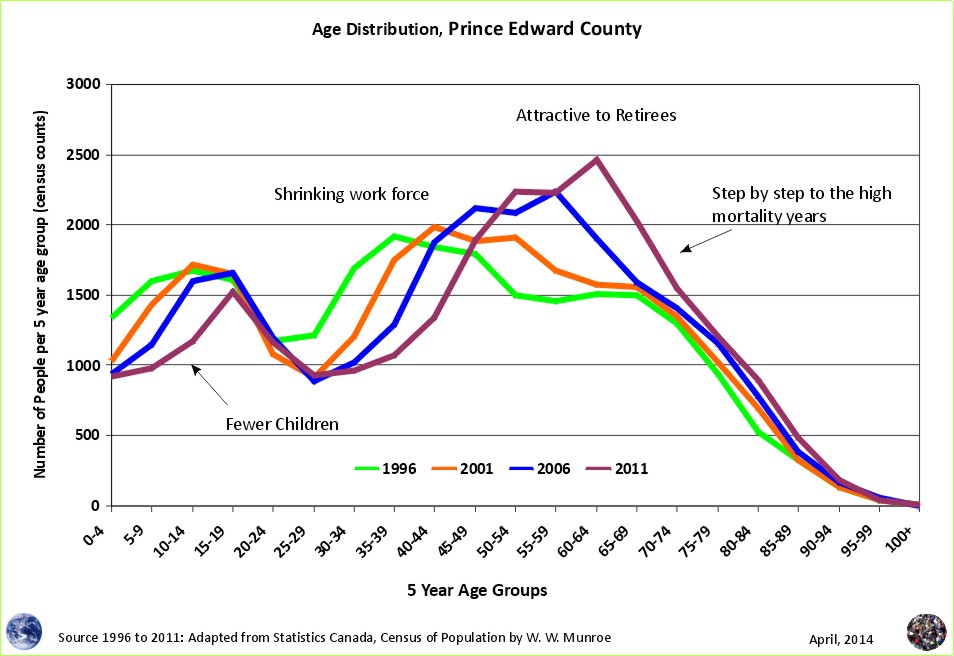
The age distribution chart above is very similar to that of the Parksville Census Agglomeration - fewer young working families (parents and their children) and more 40 to 64 year olds and elders (65 plus).

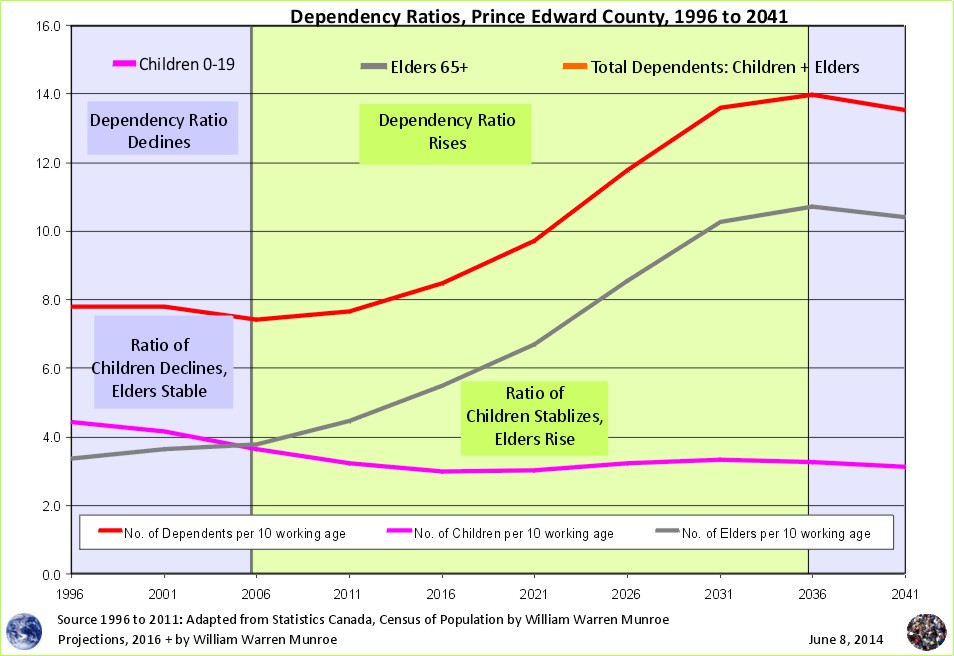
If current demographic trends continue, the number of elders (65 plus) plus children (under 20 years of age) will exceed those of working age (20 to 64) in less than 10 years as seen in Figure 2.

This average projection calculates 14 dependents for every 10 people of working age, much lower than the 22 dependents per 10 working age projected for Qualicum Beach.3

Within the county, the economic transition from agriculture and processing to retirement is reflected in the communities of Bloomfield and Wellington respectively. Similar to the east coast of Vancouver Island, cheese and wine producers and processors have replaced fruit and vegetable canneries reflecting the transition from a younger to and older, in terms of age, local population.
Reduced fertility, out-migration of young adults, less productive work, more service work, and the in-migration of retirees are reflected in the changing age distribution on the north shore of Lake Ontario and the east coast of Vancouver Island.
What do you see?
1 Canadians have arguably the best data set in the world with which to examine the changing age distribution, namely the Census of Population conducted every five years. Why?
a) Because the census is an actual count, and is more reliable than an estimate. For example, for 10 years (2000 to 2009) without informing anyone, BC Statistics estimated the population of municipalities in BC using the change in the number of telephone lines. See Disclosure Of Methods Report Considered Harmful
b) The Census of Population is public - paid for by all Canadians for the benefit of all Canadians; therefore, the counts are open, rather than closed and controlled by a small group of people in positions of government authority (i.e. BC Statistics), who can falsify numbers with Ministerial acceptance.
1996 is the starting point because this was when the Census of Population counts became available on the internet in a form comparable to later years, thus providing an understanding of recent trends.
2Adapted from Statistics Canada, 1996, 2001, 2006, and 2011 Census of Population, by William Warren Munroe
1996 Census: Catalogue Number 95F0181XDB96001.
2001 Census: Catalogue Number 97-551-XCB2006009.
2006 Census: Catalogue Number 97-551-XCB2006009.
2011 Census: Catalogue Number 98-311-XCB2011024.
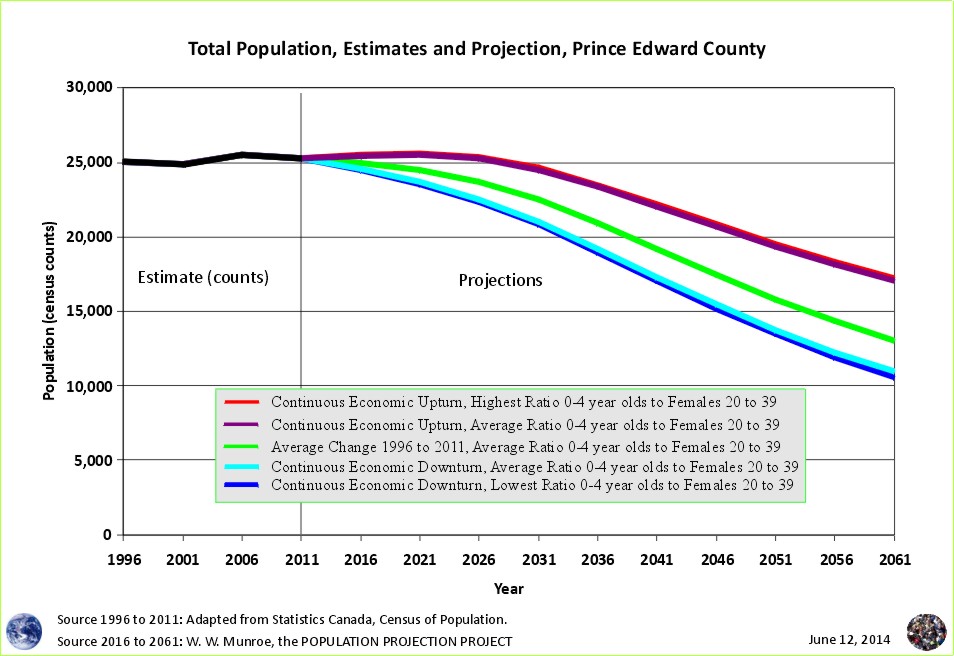
Referring to the 1996, 2001, 2006, and 2011 census counts well-defined projection scenarios (by five year age groups) can be created. For more information on how to create population projections see the Population Projection Project.
3 Perhaps this is why Qualicum Beach town councillors and the town planner (zoner) do not allow a presentation of this information at town hall meetings but do allow presentations by provincial government representatives showing a 31% population increase forecast, again without methods or other scenarios. See VIHA forecasts 30% total population increase while the Qualicum School District Superintendent forecasts 0% increase for school age children.
Outdoor Recreation to Family Formation in Tofino and Ucluelet
From Resource Extraction to Tourism and Accommodation - Ucluelet's Changing Demographics
Dependency Swap - From Fewer Children to More Elderly - What does the Sandwich Generation look like?
Population Projections for the Parksville Census Agglomeration
Why are Statistics Canada's projections so high compared to the United Nations and the Cohort Change Ratios projections? Why so different?
Government population projections for BC reflect an "up and to the right" aspiration, while the cohort change ratios method shows BC's population growth slowing, and levelling out. Read a "A Comparison of Population Projections for BC"...