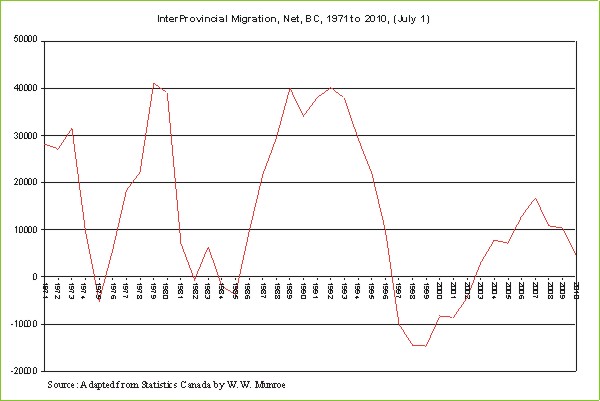
As mentioned in previous articles, net interprovincial migration is an indicator of economic cycles. The rise and fall of economic activity can be compared by looking at migration between provinces and territories over the years. By looking at this migration since the early 1970's we can see relative differences in the amount of migration as an indicator of the amount of economic activity.
In Figure #1 we see that BC's net interprovincial migration peaked at ~16,800 in 2007.

During the two previous "booms", net interprovincial migration peaked at ~40,000.
Why was net interprovincial migration this time around less than half of the previous "booms"? Will the next down turn be as deep and steep as previous busts? An examination of population change, as well as housing, non-residential building permits, and labour etc. can provide insight into short, medium, and long term forecasts for BC and the Regional Districts.
Sources:
Quarterly population estimates and factors of growth, provincial perspective - British Columbia
Table 3-11, Quarterly estimates of demographic components, provincial perspective - British Columbia http://www.statcan.gc.ca/pub/91-002-x/2011001/t344-eng.htm
Quarterly Demographic Estimates - http://www.statcan.gc.ca/bsolc/olc-cel/olc-cel?catno=91-002-X&chropg=1&lang=eng