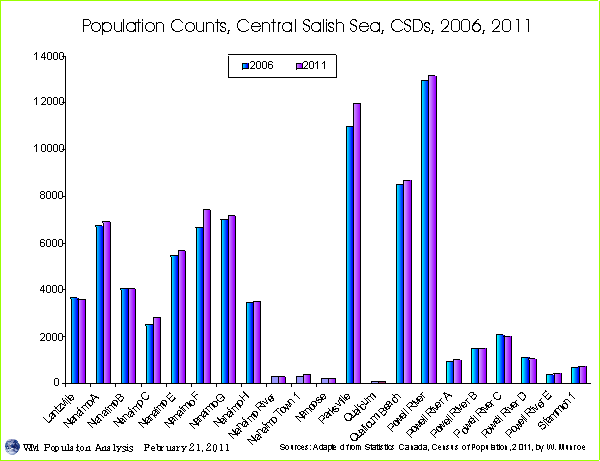
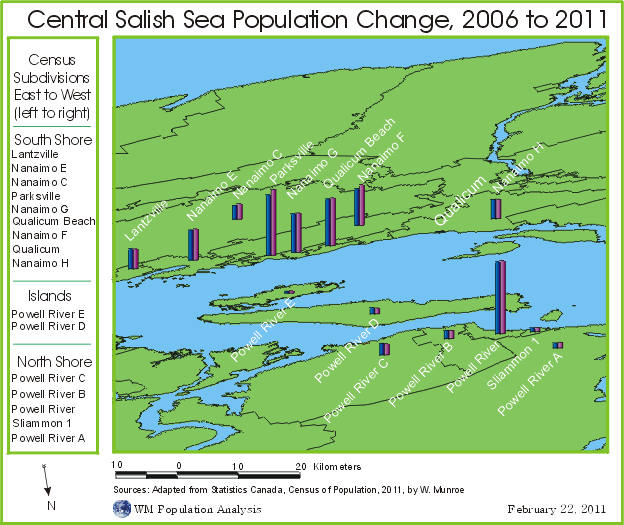
The population counts for the census subdivisions (csd) found around the central Salish Sea (see Endnote 1) show modest increases for most csds, with some having modest decreases between the 2006 and 2011 Census (see Endnote 2).

Figure 1 charts the population counts from the 2006 and 2011 Census for the CSDs surrounding the Central Salish Sea.
The Oceanside area, on the south side of the sea, includes the city of Parksville and the town of Qualicum Beach and surrounding areas.
In the fore ground of Figure 2, or the north side of the central Salish Sea, is the city of Powell River (the largest city on the Coast of the Central Salish Sea in the map) and surrounding areas. In the sea, are the islands of Lasqueti (Powell River Area - E) and Texada (Powell River Area - D). The population count rose on Lasqueti (the bar graphs are hard to see because the population in relatively small) but declined on Texada.

The population density based on the 2011 population count was approximately 11 people per square kilometer. The population count rose by approximately 3,000 people over the land area of approximately 7,000 square kilometers. For a rough comparison, the addition of 3,000 people over this area equals to 1 person per 2.25 square kilometers.
The population counts did not increase between 2006 and 2011 for Central Salish Sea CSDs as much as they had during previous "boom" times.
Fertility rates remain relatively low while the number of deaths are increasing. Net migration varies with the booms and busts of the economic cycles.
If economic activity continues to slow bewteen 2011 and the next census in 2016, net migration will likely not be able to compensate for the increasing number of deaths and the low fertility rate, resulting in more declines in the population counts for the csds surrounding the central Salish Sea.
Endnotes:
2. Statistics Canada. 2012. Population and dwelling counts, for Canada, provinces and territories, census divisions, and census subdivisions (municipalities), 2011 and 2006 censuses (table). Population and Dwelling Count Highlight Tables. 2011 Census.
Statistics Canada released the 2011 census total population and dwelling counts on February 8, 2012.
http://www12.statcan.ca/census-recensement/2011/dp-pd/hlt-fst/pd-pl/File.cfm?T=304&SR=1&RPP=9999&PR=59&CMA=0&S=51&O=A&LANG=Eng&OFT=CSV