In previous articles we found that while the number of females 20 to 39 years of age increased by nearly 100% between 1996 and 2011 (from ~220 to ~435), the number of children under 5 increased by approximately 15% (90 to 105); however, in Ucluelet, the change in the number of females is more closely tied to the change in the number of young children. Perhaps, a closer look at the 20 to 39 year old females, and males, would shed some light on the differences between these two municipalities.
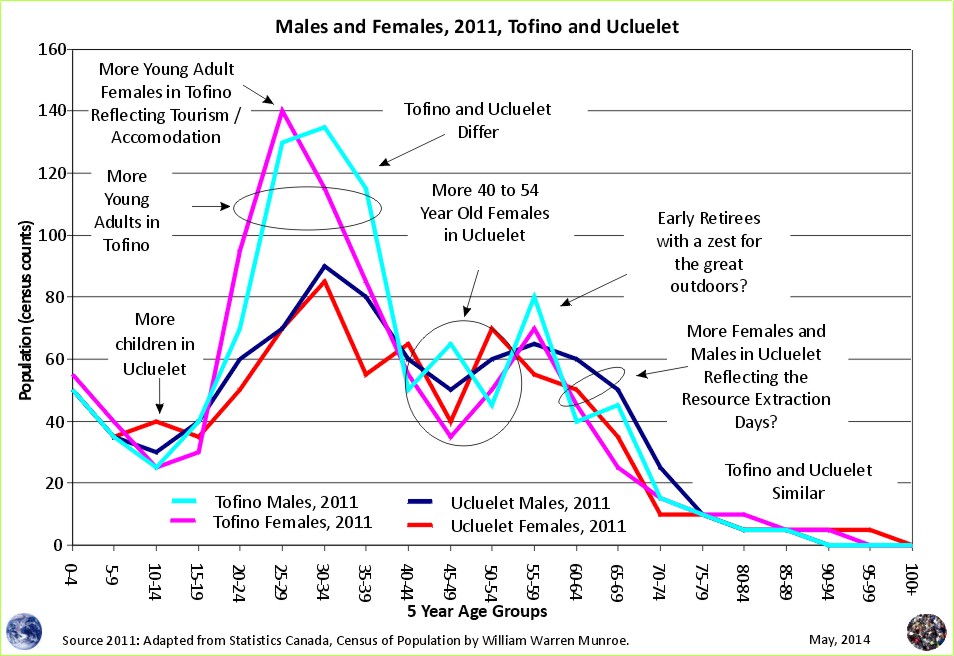
Perhaps not surprisingly, the largest female age group for Tofino is the 25 to 29 years olds, while the largest female age group is the 30 to 34 age group for Ucluelet. This age sex distribution is very different compared to the east coast of Vancouver Island where residents speak of ways to attract and retain young adults and families.
What do you see?
1 The figures for 1996, 2001, 2006, and 2011 are adapted from Statistics Canada, 1996, 2001, 2006, and 2011 Census of Population counts, by William Warren Munroe. The projections (2016 plus) are developed referring to the 1996, 2001, 2006, and 2011 census counts using the cohort change ratios method.
Statistics Canada. 2012. Population and dwelling counts, for Canada, provinces and territories, 2011 and 2006 censuses (table). Population and Dwelling Count Highlight Tables. 2011 Census. Statistics Canada Catalogue no. 98-310-XWE2011002. Released February 8, 2012. http://www12.statcan.ca/census-recensement/2011/dp-pd/hlt-fst/pd-pl/File.cfm?T=101&SR=1&RPP=25&PR=0&CMA=0&S=50&O=A&LANG=Eng&OFT=CSV (accessed February 08, 2012). For further information, refer to: http://www12.statcan.gc.ca/census-recensement/2011/dp-pd/hlt-fst/pd-pl/Notes-eng.cfm.
Population Projections for the Parksville Census Agglomeration
Why are Statistics Canada's projections so high compared to the United Nations and the Cohort Change Ratios projections?
Government population projections for BC reflect an "up and to the right" aspiration, while the cohort change ratios method shows BC's population growth slowing, and levelling out. Read a "A Comparison of Population Projections for BC"...