During the last 50 years of the 20th century, a demographic revolution occurred in Canada along with many other countries around the world. The often referred to population pyramid created by high births and deaths changed shape as Canadians began to live longer and reproduce less. Yet, while the revolution from above to below replacement fertility combined with longer life is well underway, a vestige of the past remains, namely, oscillations in the age distribution; however, the current oscillations are for very different reasons than in the past, reflecting a new reality for the 21st century.
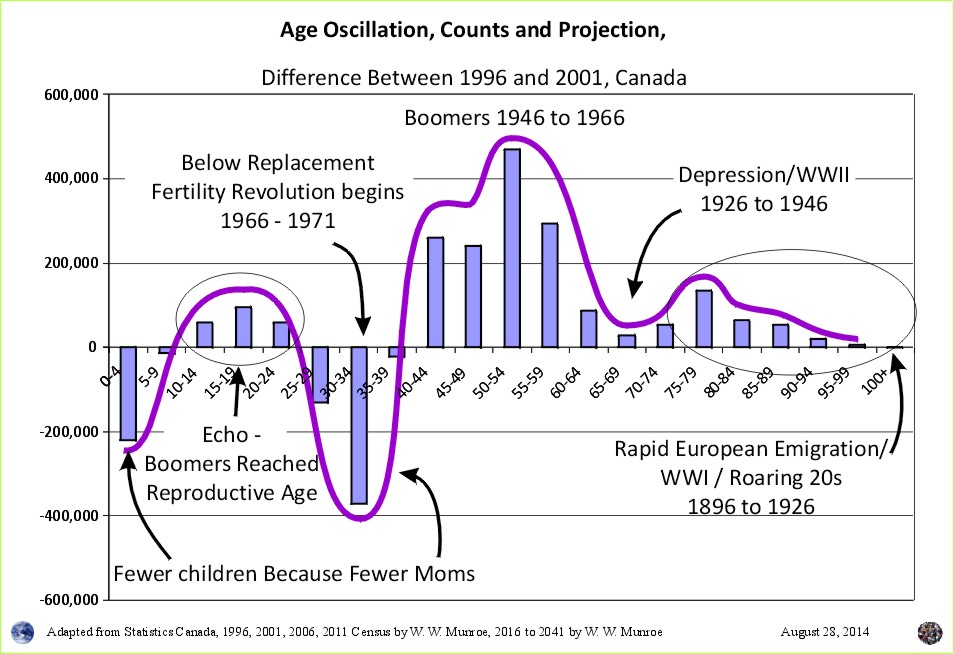
Canada has arguably the best dataset in the world with which to examine demographic trends, namely the Census of Population conducted every 5 years. Lets take a look at the difference between the last census of the 20th century (1996) and the first census of the 21st century (2001) to examine the change in Canadas 5 year age groups. This change between 1996 and 2001 provides a view to events that have impacted Canada's population since 1896. The number of people 100 years of age and over counted in 1996 - those born in, and prior to, 1896 - was 3,125. These people were born during the population explosion in Europe and the rapid emigration outward to many places around the world including to Canada.
As discussed in previous articles, the baby boomers are the result of the continuation of the above replacement fertility (a continuation of the pyramid shaped age sex distribution) following the warring madness in Europe, ending (cooling off?) in 1945.
In this chart of the difference in the census counts between 1996 and 2001, the change in the 50 to 54 year olds reflects the change that occurred 50 to 54 years earlier, between 1946 and 1951. Notice also the change in the 55 to 59 year olds, people born between 1941 and 1946 - during WWII. The increase in population during the war reflects the increase in the number of 20 to 24 year olds, a result of the increase in the number of children born during the roaring twenties, from 1921 to 1926. People born outside of Canada during the war, may also have contributed an unusually high number of in-migrants to Canada over the years.
Between 1946 and 1951, the number of children 0 to 4 years of age compared to the number of 0 to 4 year olds counted in 1941 to 1946 increased rapidly. Now (between 2011 and 2016) this large increase of approximately 460,000 people is aging from the 60 to 64 year age group into the 65 to 69 year age group.
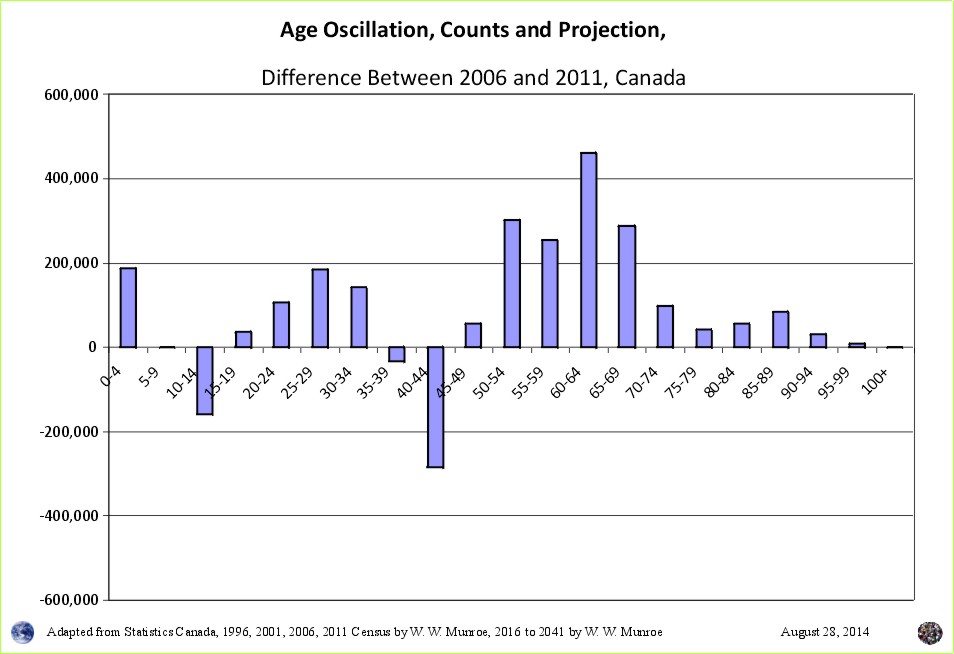
In Chart #2, we can see the peak of the boomers, people aged 50 to 54 in Chart #1 (and everyone else) have aged 10 years. Between 1951 and 1956, the boom continued with another increase of approximately 250,000 people compared to 1946 to 1951. Notice in Chart #2, the dip in the number of 55 to 59 year olds, people born between 1951 and 1956 followed by an increase in the 50 to 54 year olds (born between 1956 and 1961). This dip reflects the reduced number of 20 to 24 year olds in the early 1950s due to fewer births 20 years previous -during the great depression, between 1931 and 1936. This age group will be aging into retirement (65 plus) between 2016 and 2021.
Together, from 2011 to 2021, an additional 710,000 "boomers" will be reaching retirement age. The 2006 census shows there were 3.7 million 55 to 64 year olds while the 2011 census shows there were 4.4 million 55 to 64 year olds, an increase of 710,000 people born in the decade after WWII. Many were born and fewer died.
The last of the boomers (those born between 1961 and 1966) will age into the 65 to 69 age group in 2026 with some continuing to work as retirement age adjusts to the elongated life of Canadians. This age group, those born between 1946 and 1966, the boomers, represents the end of the population pyramid followed by a very different age structure and society.
The below replacement fertility revolution began in the 1960s resulting in the decline in number of 30 to 44 year olds at the end of the century as seen in the chart#1; however, as the largest number of boomers (born in the early 1960s) aged into their 20s, in the 1980s, the number of births increased again. These are the 10 to 24 year olds who make up the "echo" part of "boom, bust, echo".
After the decline in those under 10 years of age, there should be another echo as the 10 to 24 year olds age into reproductive age as seen in chart #2. To add another demographic trend, reproductive age is being delayed from early 20s to later 20s and 30s
This shift to delayed reproduction, possibly in part a result of both education specialization and longer life (shorter life more children, longer life fewer children), reduces the potential for births - the range of reproduction is narrowing from 20 to 39 years of age to 25 to 39 and in some areas to 30 to 39 years of age, thus lowering the number of births to below replacement. See the article The Sign On the Maternity Ward Door says "Gone Surfing" describing the population change during the economic change from resource extraction to outdoor recreation (tourism/accommodation) on the west coast of Canada.
During above replacement fertility phases declines in fertility do occur, sometimes because of above replacement fertility resulting in war, disease, destruction of productive capacity followed by famine and more disease. Plato thought "every precaution must be taken to avoid war. The primary occasion is overpopulation". In the charts above we can see that the population pyramid created by above replacement fertility and high number of deaths across each age group is impacted by war. The drops in numbers of people are pointed out in chart #1. Notice the dip in the number of people 65 to 69 years resulting from the great depression between 1931 and 1936.
Towards the end of the 20th century, we see in chart #1, less of warring psychosis (although not cured) and more the reverberation resulting from the acceptance and practice of reduced fertility, coupled with longer education/recreation years resulting in shorter reproductive years, and longer life.
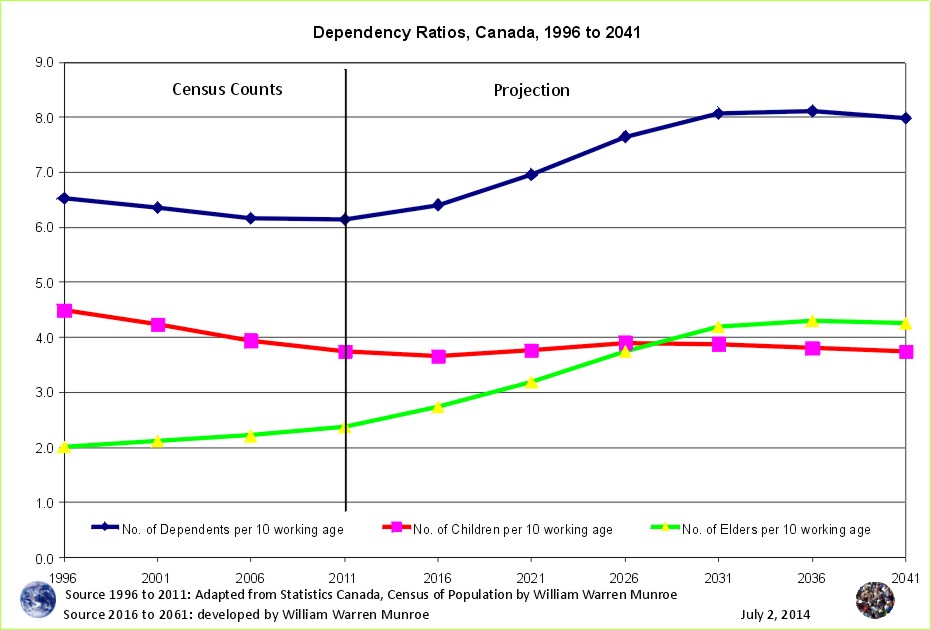
Canada's medium scenario projection sees the total population levelling out at around 40 to 45 million by mid century (cohort change ratios method and the United Nations; however, Statistics Canada and other official statistical agencies within Canada (i.e. BC Statistics) maintain an up and to the right aspiration drawing a straight line to above the 50 million mark by 2061. Perhaps this ideal reflects Statistics Canada's trumpeting "Canada's population increased at a faster rate than the population of any other member of the G8 group of industrialized nations between 2006 and 2011." Of course, Canada's population appears to increase at a "faster rate" because Canada has by far the lowest population of the G8 countries).
Long waves in economic activity have been observed for many years and do impact migration thus population. Also, population booms usually occur in tandem with economic booms - the more wealth the more babies; however, as we have seen this inclination is changing with delayed reproduction.
In 2004, Statistics Canada went on tour across Canada to highlight the need for more international in-migration to address labour shortages resulting from the retiring boomers. This may in part explain the increase in the number of 20 to 39 year olds due to more in-migration than out-migration since 1996. Between each census this age group increased from an additional 117,520 (1996 to 2001) to 290,39 (2001 to 2006) to 467,190 (2006 to 2011), and as we can see in chart #2 this has helped increase the number of 0 to 4 year olds. The Census of Population can provide insight into migration as seen in the "Population Signatures" discussed in many previous articles.
While the medium scenario projects the number of people of working age to level out around 23 million, there is considerable variation in the 5 year age groups within the 15 to 64 year old age group as seen in the charts above. If current demographic trends continue, what will the change between 2011 and 2016, and every five years to 2041, look like? Let's take a look at the oscillations projection to 2041 created from cohort changes ratios seen in Canada's 1996 to 2011 Census of Population in the next article.
1 The figures for 1996, 2001, 2006, and 2011 are adapted from Statistics Canada, 1996, 2001, 2006, and 2011 Census of Population counts, by William Warren Munroe. The 2016 to 2041 projection numbers by William Warren Munroe are created using the cohort change ratios method based on the 1996, 2001, 2006, and 2011 Census of Population counts from Statistics Canada's website.
2Statistics Canada. 2012. Population and dwelling counts, for Canada, provinces and territories, 2011 and 2006 censuses (table). Population and Dwelling Count Highlight Tables. 2011 Census. Statistics Canada Catalogue no. 98-310-XWE2011002. Released February 8, 2012. http://www12.statcan.ca/census-recensement/2011/dp-pd/hlt-fst/pd-pl/File.cfm?T=101&SR=1&RPP=25&PR=0&CMA=0&S=50&O=A&LANG=Eng&OFT=CSV (accessed February 08, 2012). For further information, refer to: http://www12.statcan.gc.ca/census-recensement/2011/dp-pd/hlt-fst/pd-pl/Notes-eng.cfm.
Population Projection Project for Canada's Census Areas
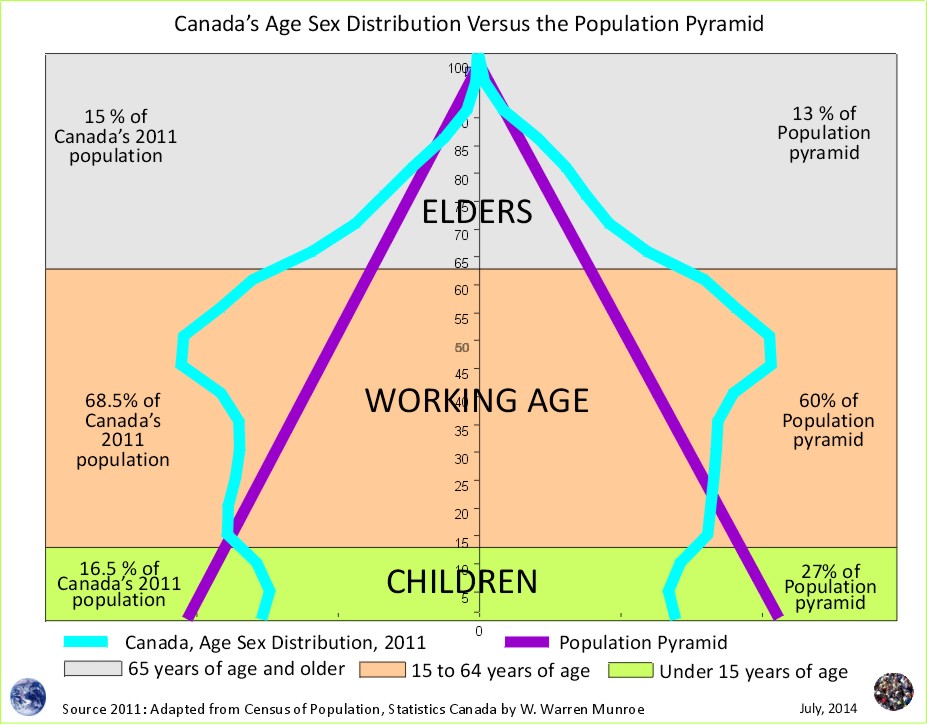
 Take a look at Canada's Age Sex Distribution animated projection (medium scenario). The animation starts at 1996 and clicks through to 2041. Notice in the 1996 chart, the baby boom bulge (which is just the resumption of more births than deaths - the population pyramid - after WW2) followed by fewer numbers in the younger age groups reflecting (resulting from) reduced fertility beginning in the mid 1960s. This medium scenario projection is an average of the 1996 to 2011 cohort change ratios thus creating a central tendency that eventually provides smooth lines in the younger age groups by the end of the projection period.
Why are Statistics Canada's projections so high compared to the United Nations and the Cohort Change Ratios projections?
Government population projections for BC reflect an "up and to the right" aspiration, while the cohort change ratios method shows BC's population growth slowing, and levelling out. Read a "A Comparison of Population Projections for BC"...