
Many people have been asking about the increase in elementary school enrolment - Is this happening and if so why - What's going on?
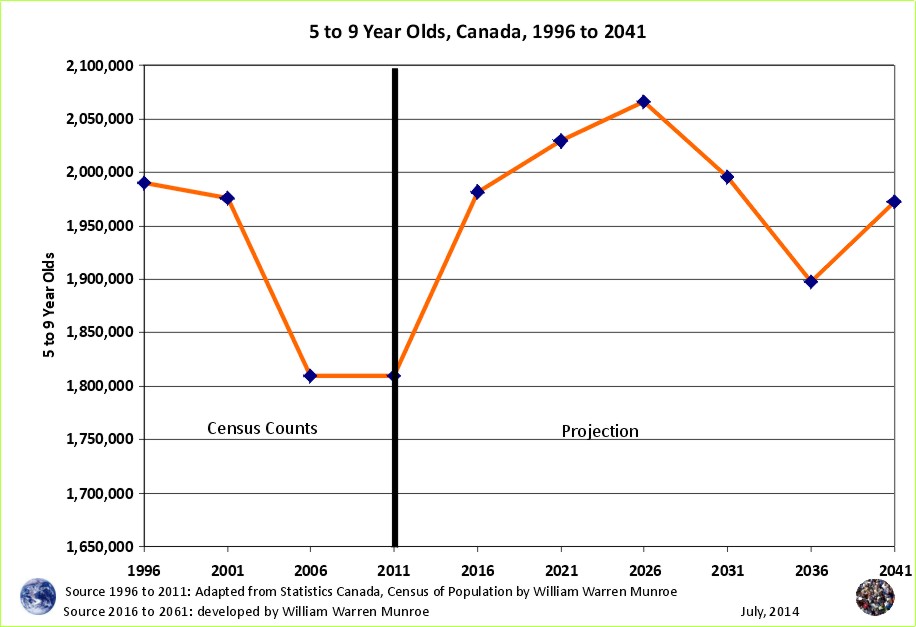
In the July 1, 2014 article we saw the census counts and projection (medium scenario) for those under 5 years of age within Canada. Since those 0 to 4 years of age counted in 2011 was considerably higher than those in this age group counted in 2006, we should see the number of those 5 to 9 years of age, (Kindergarten to Grade 4) increase between 2011 and 2016. Let's take a look.
Of course there is considerable variation in the change in the number of those 0 to 4 years of age between 2006 and 2011 between areas in Canada. For example, some towns show a very small increase in the children under 5 years of age between 2006 and 2011; however, if the same small towns are attractive to families with young children moving from high density areas, we may see that the large increases in under 5 year olds in high density areas may result in an increase in in-migration of young children and their parents/guardians to bedroom communities. This should be interesting to watch for in the 2016 census.
What are the numbers? The number of 0 to 4 year olds increased by 186,555 between 2006 (1,690,540) and 2011 (1,877,095) while the number of 5 to 9s changed little (increasing by 520) between 2006 (1,809,375) and 2011 (1,809,895); however, the projection shows an increase to 1,982,011 5 to 9 year olds by 2016 (Canada is also attractive to families)2. The increase of over 170,000 Kindergarten and Elementary school aged children with let's say 20 per class, means there should be approximately 8,600 more classes and teachers needed over the 5 year period from 2011 to 2016.
Should we be closing elementary schools?
What do you think?
1 The figures for 1996, 2001, 2006, and 2011 are adapted from Statistics Canada, 1996, 2001, 2006, and 2011 Census of Population counts, by William Warren Munroe. The projections (2016 plus) are developed referring to the 1996, 2001, 2006, and 2011 census counts using the cohort change ratios method.
Statistics Canada. 2012. Population and dwelling counts, for Canada, provinces and territories, 2011 and 2006 censuses (table). Population and Dwelling Count Highlight Tables. 2011 Census. Statistics Canada Catalogue no. 98-310-XWE2011002. Released February 8, 2012. http://www12.statcan.ca/census-recensement/2011/dp-pd/hlt-fst/pd-pl/File.cfm?T=101&SR=1&RPP=25&PR=0&CMA=0&S=50&O=A&LANG=Eng&OFT=CSV (accessed February 08, 2012). For further information, refer to: http://www12.statcan.gc.ca/census-recensement/2011/dp-pd/hlt-fst/pd-pl/Notes-eng.cfm.
2See the write up of the 2008 Global to Local Population Change presentation to the local Chamber of Commerce.
Population Projection Project for Canada's Census Areas
 Take a look at Canada's Age Sex Distribution animated projection (medium scenario). The animation starts at 1996 and clicks through to 2041. Notice in the 1996 chart, the baby boom bulge (which is just the resumption of more births than deaths - the population pyramid - after WW2) followed by fewer numbers in the younger age groups reflecting (resulting from) reduced fertility beginning in the mid 1960s. This medium scenario is an average of the 1996 to 2011 cohort change ratios thus creating a central tendency that eventually provides smooth lines in the younger age groups by the end of the projection period.
Why are Statistics Canada's projections so high compared to the United Nations and the Cohort Change Ratios projections?
Government population projections for BC reflect an "up and to the right" aspiration, while the cohort change ratios method shows BC's population growth slowing, and levelling out. Read a "A Comparison of Population Projections for BC"...