Penticton Census Agglomeration1 experienced a decline in total population between 2006 and 2011 according to census counts from Statistics Canada2. While the decline was marginal (nearly 1,000 people), it may be the begining of steeper declines as the elders age into the high mortality years (70 plus) followed by below replacement fertility. Will migration rise rapidly enough to compensate? That depends on the "boom bust" - economic - cycle.
First, let's take a look at the Age Distributions from 1996 to 2006

Notice how the shapes of the age distribution are similar (but not exactly the same) and are stepping five years ahead, particularly for the 30 to 40 year olds. Now let's add 2011 census counts and take a closer look at the different age groups.

The Penticton CA was not so attractive to retirees as in the past. Between 2006 and 2011 the number of retirees in their late sixties and early seventies declined. Even though the area traditionally has seen large numbers of retirees moving in, the 2011 census counts show declines.
The number of those 75 plus changed very little between 2006 and 2011 but of course the number of deaths rose.
The number of children has dropped substantially since 1996, from ~ (approximately) 7,300 by nearly 2,000 - over one quarter fewer children under 15.
The number of people 30 to 45 years of age, dropped by 30% from ~9,000 by nearly 2,600, to just under 6,300.
The number of those in early retirement years of 55 to 65, has increased by 50% since 1996, due to aging of the local population combined with positive net migration.
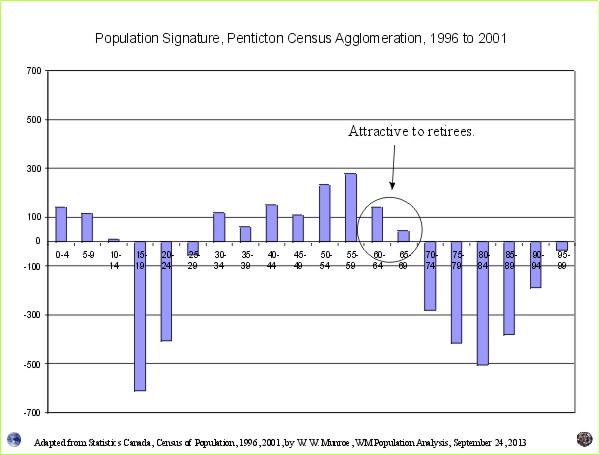
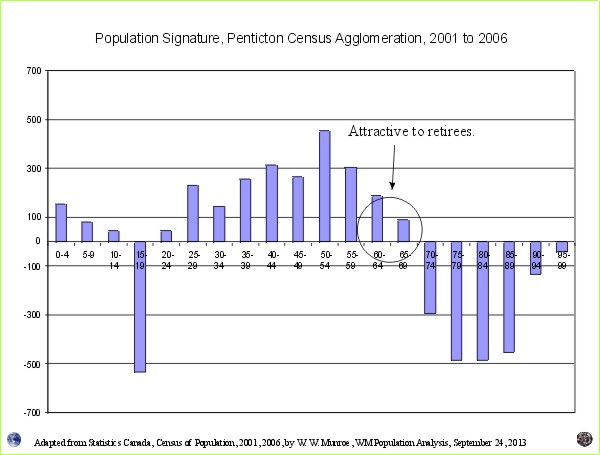
Now let's take a look at the Population Signatures3.


By 2011, the number of 60 to 64 years olds declined when compared to the number of 55 to 59 years olds from five years previous.
The same goes for the number of thoses aged 60 to 64 year of age in 2006 when compared to the number of those aged 65 to 69 counted in 2011.
Why? Because out-migration and deaths exceeded in-migration for these age groups.
Usually during a downturn in the economy, net migration becomes less positive and the numbers are not sufficient to compensate for the increase in number of deaths. Thus the overall decline in total population for the area.
Over all, migration was down for all age groups compared to census results between 1996 to 2006. In the last census period, between 2006 and 2011, far fewer families (children under 15 and those aged 30 to 55) moved to the area.
The population signature for 2006 to 2011 were as low as during the last down-turn in economic activity in BC, 1996 to 2001. Indeed, BC’s net interprovincial migration became negative again in 2011 as it did in the late 1990s.
What do you see?
1 The Penticton Census Agglomeration is made up of Penticton City, Penticton IRI, Okanagan-Similkameen D, E, F.
2 1996 2001 Source: Statistics Canada - Cat. No. 97F0003XCB2001001.
2006 Source: Statistics Canada - 2006 Census. Catalogue Number 97-551-XCB2006009.
2011 Source: Statistics Canada - 2011 Census. Catalogue Number 98-311-XCB2011021.
visit Statistics Canada's website at http://www12.statcan.ca/census-recensement/2011/dp-pd/tbt-tt/Index-eng.cfm
3 To make Population Signatures, just compare each of the five year age groups from one census with the next five year age group from the next census five years later. If no one moved or died, the numbers would be the same; however, the numbers are different due to net migration and mortality. This difference is seen in these charts, and provides the cohort change ratios used to create the Age/Sex projection. See how they are created.
COMMENT: This summer, I was told that the population projections for the area are for 2% growth increases per year; however, a local expert told me that this growth was not occurring. Upon requesting improvements to the methods which created the 2% growth projection, the local expert was told that adjustments to the projections are "too complicated"; therefore, the imposed projections must be used for planning purposes. In order to provide "uncomplicated" population projections visit the Population Projection Project.