According to Carleton University professor, Linda Duxbury, "The huge group of baby boomers leaving the labour market is going to have repercussions in every workplace." Duxbury adds "... the aging of the population and the undersupply of youth is going to present a challenge we have not experienced since the fall of the Roman Empire." To address the anticipated labour shortfall Duxbury forecasts "we would require 650,000 to 750,000 skilled immigrants of working age every year."1. Really?
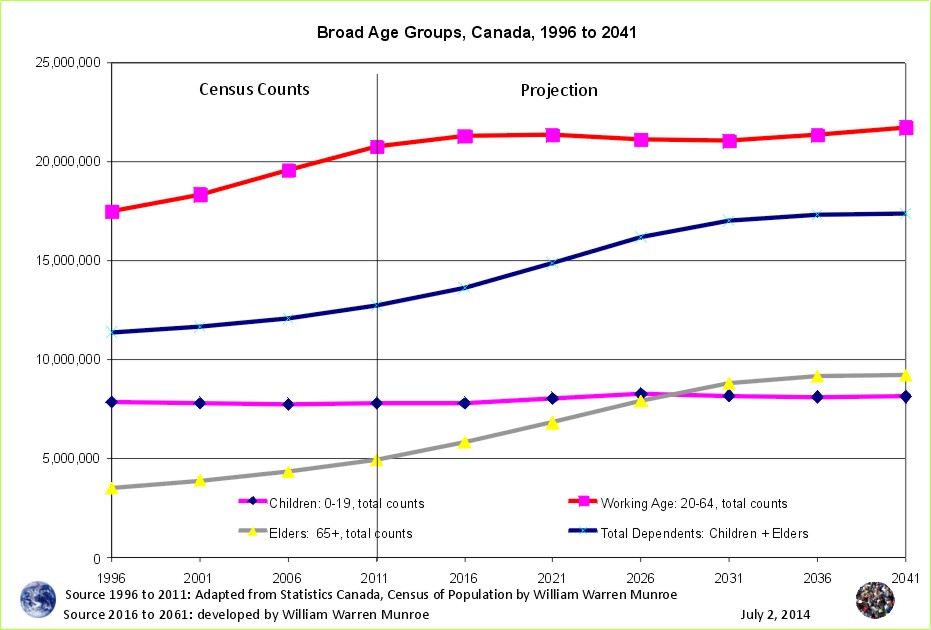
Lets take a look the number of people of "working age" (15 to 64 years of age) as well as the number of children (under 15), elders (65 and older) "every [census] year" since 1996, with the addition of the medium scenario projection to 2041.2
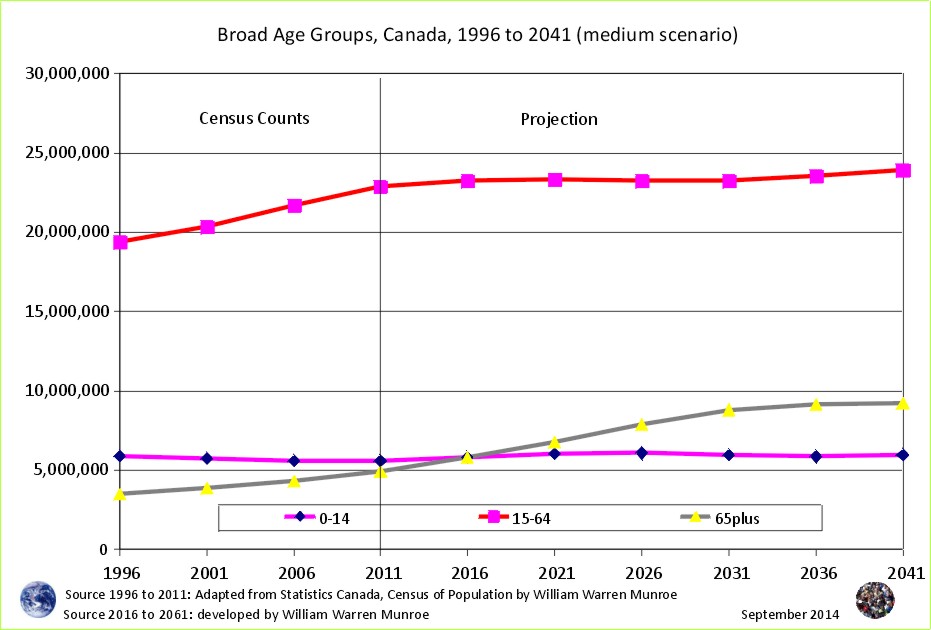
The chart shows the number of people of working age gradually levelling out at around 23 million; however, the table reveals a very small decline between 2021 and 2031.
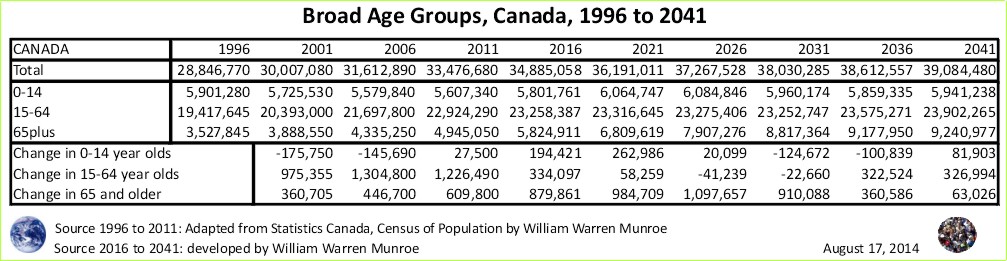
The medium scenario projects the number of people 15 to 64 years of age inclusive will continue to rise to 2021 (although more slowly) followed by a modest decline of approximately 41,000 people between 2021 and 2026, then by another 22,660 people between 2026 and 2031 followed thereafter by increases to 2041 - well short of 3/4 of a million per year.
Relative to the total number of people 15 to 64 years of age projected for 2021 (23.3 million), the decline of approximately 41,200 people equals a decline of less than one percent ( > 0.2% ).
This means that for every 1,000 people of working age there would be 2 fewer people over the 5 year period from 2021 and 2026, followed by approximately 1 person fewer out of a 1,000 between 2026 and 2031.
Rather than a labour shortfall due to the boomers retiring, thus requiring "650,000 to 750,000 skilled immigrants of working age every year", for Canada as a whole, the modest decline means there will be 8,250 fewer people of working age on average for every year from 2021 to 2026, followed by 4,500 fewer on average for every year from 2026 to 2031 out of a work force of 23.3 million people. So where did the figures 650,000 to 750,000 of working age every year come from?
Thankfully, Duxbury provided a chart from a study by Rick Miner, PhD; however, the study did not benefit from the the 2011 census counts.
Understanding how projections are created is fundamental to decision / policy making. Former Chief Statistician for Statistics Canada,Ivan Fellegi, asked:
Perhaps University Professors and students could analyze the methods and findings and provide refinements, not only to ensure they are correct but to better understand the strengths and weaknesses - to better understand what the "findings" mean.4
Duxbury correctly points out that within the large 15 to 64 working age group there is considerable variation and change that would be interesting to view more closely. The oscillations in the age distribution (5 year age groups to match the 5 year census), the aging of the boomers, and the echo, bust, echo, etc. will be the subject of the next article.
1 The Future of Work, by David McDonald, found in the Spring 2013 edition of the Carleton University Magazine.
2 The figures for 1996, 2001, 2006, and 2011 are adapted from Statistics Canada, 1996, 2001, 2006, and 2011 Census of Population counts, by William Warren Munroe.
The figures for 2016 to 2041 are developed by William Warren Munroe using the Canadas population projection (medium scenario created using the cohort change ratios method based on the 1996, 2001, 2006, and 2011 Census of Population counts.
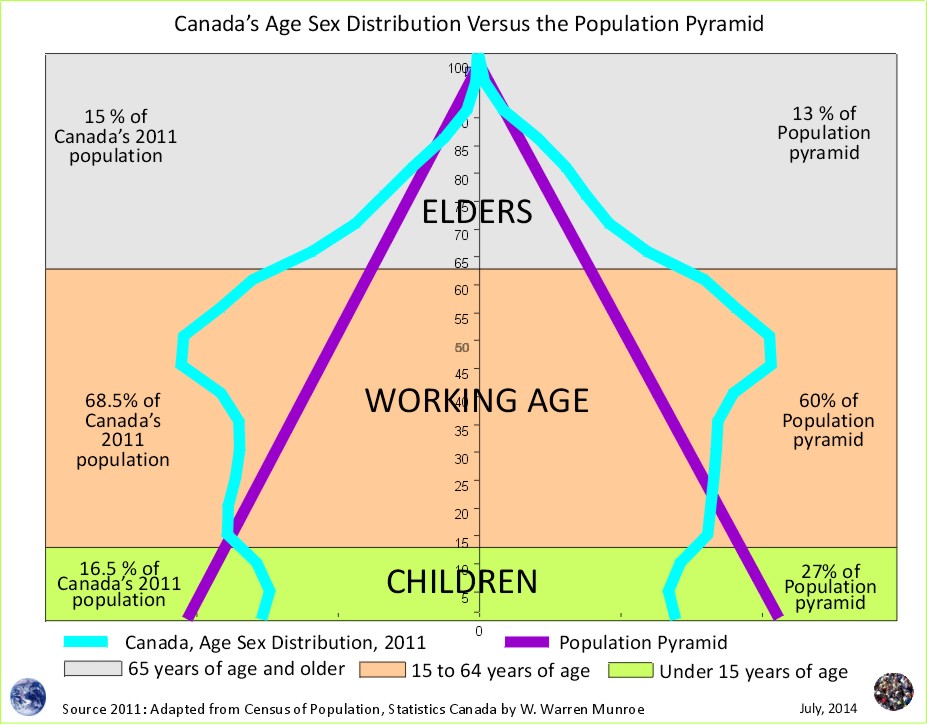
Working age often refers to 15 to 64 year olds (Statistics Canada uses this age group); however, 20 to 64 or 20 to 69 have also been used in previous articles for times and places where these are considered appropriate. These groupings may be used more often as we move into an elongated life - longer to specialize, reproducing later in life, working late (to 69) and living longer. See the chart Broad Age Groups, Canada, 1996 to 2041 from last month's article.
Statistics Canada. 2012. Population and dwelling counts, for Canada, provinces and territories, 2011 and 2006 censuses (table). Population and Dwelling Count Highlight Tables. 2011 Census. Statistics Canada Catalogue no. 98-310-XWE2011002. Released February 8, 2012. http://www12.statcan.ca/census-recensement/2011/dp-pd/hlt-fst/pd-pl/File.cfm?T=101&SR=1&RPP=25&PR=0&CMA=0&S=50&O=A&LANG=Eng&OFT=CSV (accessed February 08, 2012). For further information, refer to: http://www12.statcan.gc.ca/census-recensement/2011/dp-pd/hlt-fst/pd-pl/Notes-eng.cfm.
3 http://www.unece.org/stats/documents/ces/1999/9.e.pdf - Prepared by Ivan Fellegi. Economic and Social Council, UNITED NATIONS Distr. GENERAL, CES/1999/9, 23 March 1999, ORIGINAL : ENGLISH, STATISTICAL COMMISSION and ECONOMIC COMMISSION FOR EUROPE, CONFERENCE OF EUROPEAN STATISTICIANS, Forty-seventh plenary session, (Neuchâtel, Switzerland, 14-16 June 1999), ANALYTIC ACTIVITIES AT STATISTICS CANADA
4 In a 2005 feasibility study for Finance Canada addressing methods for equalization payments, Statistics Canada stated that post census methods for calculating population numbers from BC Statistics were of better quality than Statistics Canada's; however, BC Statistics had misinformed Statistics Canada, providing incorrect methods and numbers (see the presentation to the Canadian Population Society at the 2013 Congress). In 2012 Statistics Canada asked Population Analysts to participate in efforts to improve projection methods. Thankfully, some citizens and experts are raising awareness about the importance of integrity. Insist on seeing the methods used to create numbers, not only to ensure they are correct, but to better understand the strengths and weaknesses of the methods and the numbers. Tax funded studies must be accompanied with the correct methods and citations, otherwise withholding methods and citations can reasonably be seen to demonstrate a lack of integrity. See the 2013 Congress presentation addressing BC Statistics provision of incorrect methods and numbers to Statistics Canada for a 2005 study of methods to be used for equalization payments - the June 6, 2013 article
Population Projection Project for Canada's Census Areas
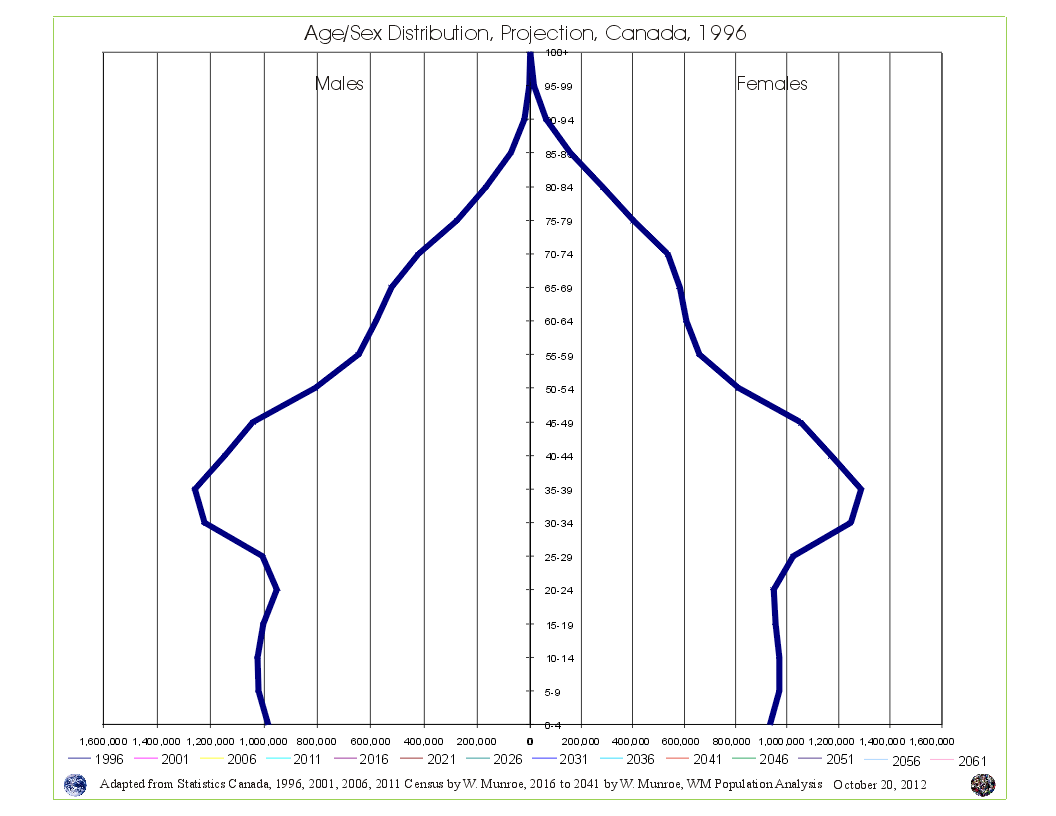 Take a look at Canada's Age Sex Distribution animated projection (medium scenario). The animation starts at 1996 and clicks through to 2041. Notice in the 1996 chart, the baby boom bulge (which is just the resumption of more births than deaths - the population pyramid - after WW2) followed by fewer numbers in the younger age groups reflecting (resulting from) reduced fertility beginning in the mid 1960s. This medium scenario projection is an average of the 1996 to 2011 cohort change ratios thus creating a central tendency that eventually provides smooth lines in the younger age groups by the end of the projection period.
Why are Statistics Canada's projections so high compared to the United Nations and the Cohort Change Ratios projections?
Government population projections for BC reflect an "up and to the right" aspiration, while the cohort change ratios method shows BC's population growth slowing, and levelling out. Read a "A Comparison of Population Projections for BC"...