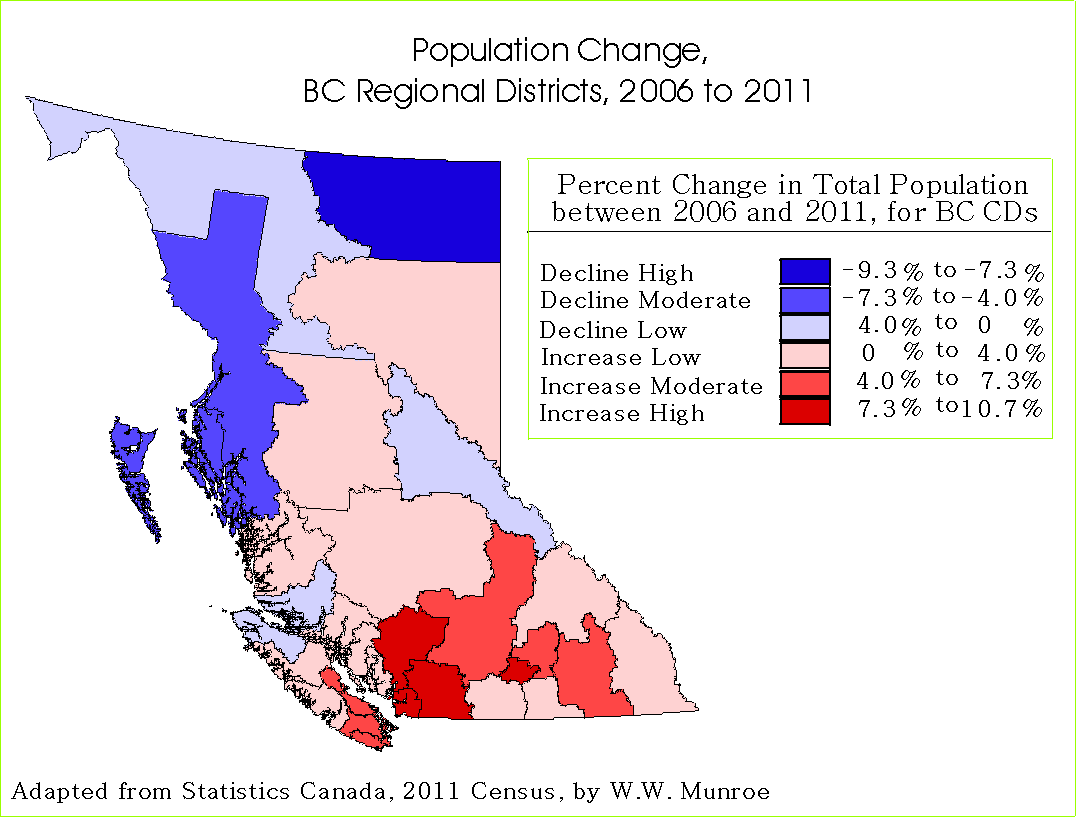
The number of people and dwellings in all census divisions (regional districts in BC) were counted in May 2011 and the results were released on February 8, 2012 by Statistics Canada.
What can we see by looking at these numbers? First of all, it is important to understand that like any measure there is error. The Census usually misses about 3% to 5% of the population. For BC, the 2011 Census of the population counted 4,400,057. This is about 150,000 fewer people than Statistics Canada’s estimate of BC’s population published September 28, 2011, roughly the number of people living in the Nanaimo Regional District (RDN).
It is likely that when the amount of error is estimated (using a method referred to as the reverse record check) the population estimates will be adjusted accordingly (to be available in September 2013). This adjustment will be made to the Regional District level.
With this in mind, we can look at census population counts to small areas as having a varying amount of error. Nonetheless, we can see the actual counts from one census to the next, and if the error is around the same for each census we can get an idea of whether there are big changes (outside of the margin of error) in the population. When we look at the population counts between the 2006 and the 2011 Census, we see that the change in the counts is modest and in many cases within the margin of error. Indeed, it appears as though the population in the Central Eastern Vancouver Island area has had relatively modest growth with some areas experiencing modest declines. Overall, it appears as though the rate of population growth is slowing from nearly 10% between 2001 and 2006, to closer to 5% between 2006 and 2011 for the RDN.
Here is a link to a map showing the difference in population counts between 2006 and 2011 for the census subdivisions surrounding the central Salish Sea, including the Nanaimo and Powell River RDs:

While counting people is not so easy (they move around) the count of occupied dwellings is usually more accurate. There were 4,593 more private occupied dwellings counted in 2011 than in 2006 for the whole of the Nanaimo Regional District; however, there were only 7,943 more people counted; therefore, there were only 1.7 people per these new dwellings, well below the average of 2.6 people per dwelling in 2006, bringing down the average to 2.4 people per dwelling counted in 2011.
We see these types of low numbers of people per dwelling in high density areas with apartments occupied by one or two people. Multi dwelling units are attractive to both young single adults, living in large cities (like downtown Vancouver), as well as older people without children at home, who move to lower density areas outside of high commuter flow areas (like Oceanside). Efforts to concentrate population growth into high density areas in the RDN may be simply a matter of accommodating current trends.
It appears that the move from single family dwellings to multi-unit dwellings for those of retirement age is reflected in the population and dwelling counts. Therefore the difference in the average cost for single family dwellings and for multi-unit dwellings will likely continue to decrease. We may see more single family dwellings for sale, thereby increasing the supply and decreasing the cost, thus attracting families.
While there is error in the census counts, as with any measure, the numbers can provide insight into fundamental characteristics that make up communities.