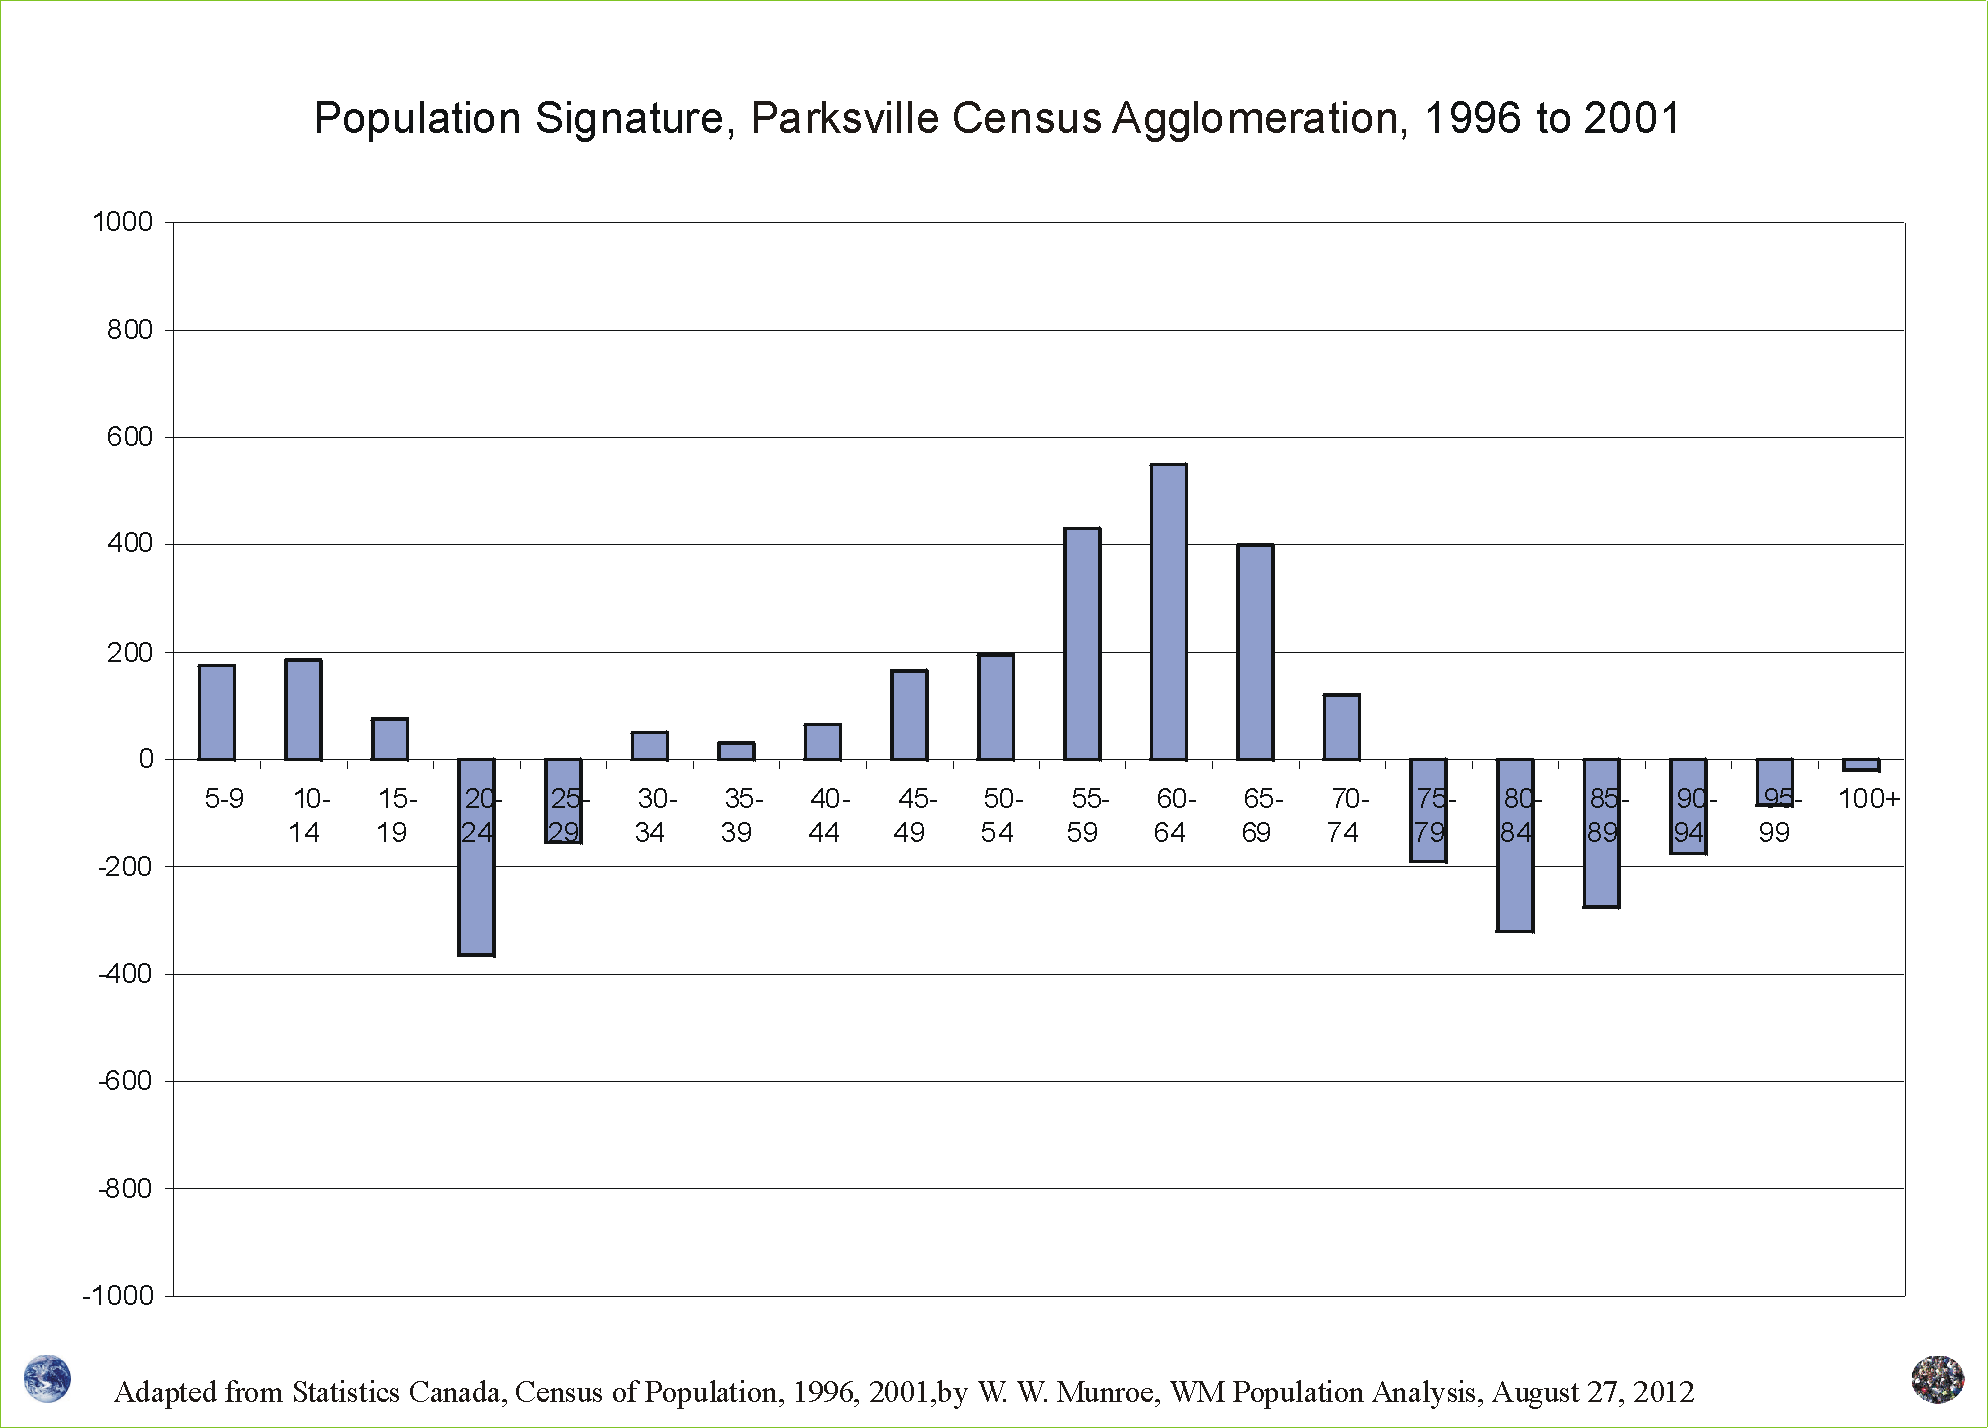
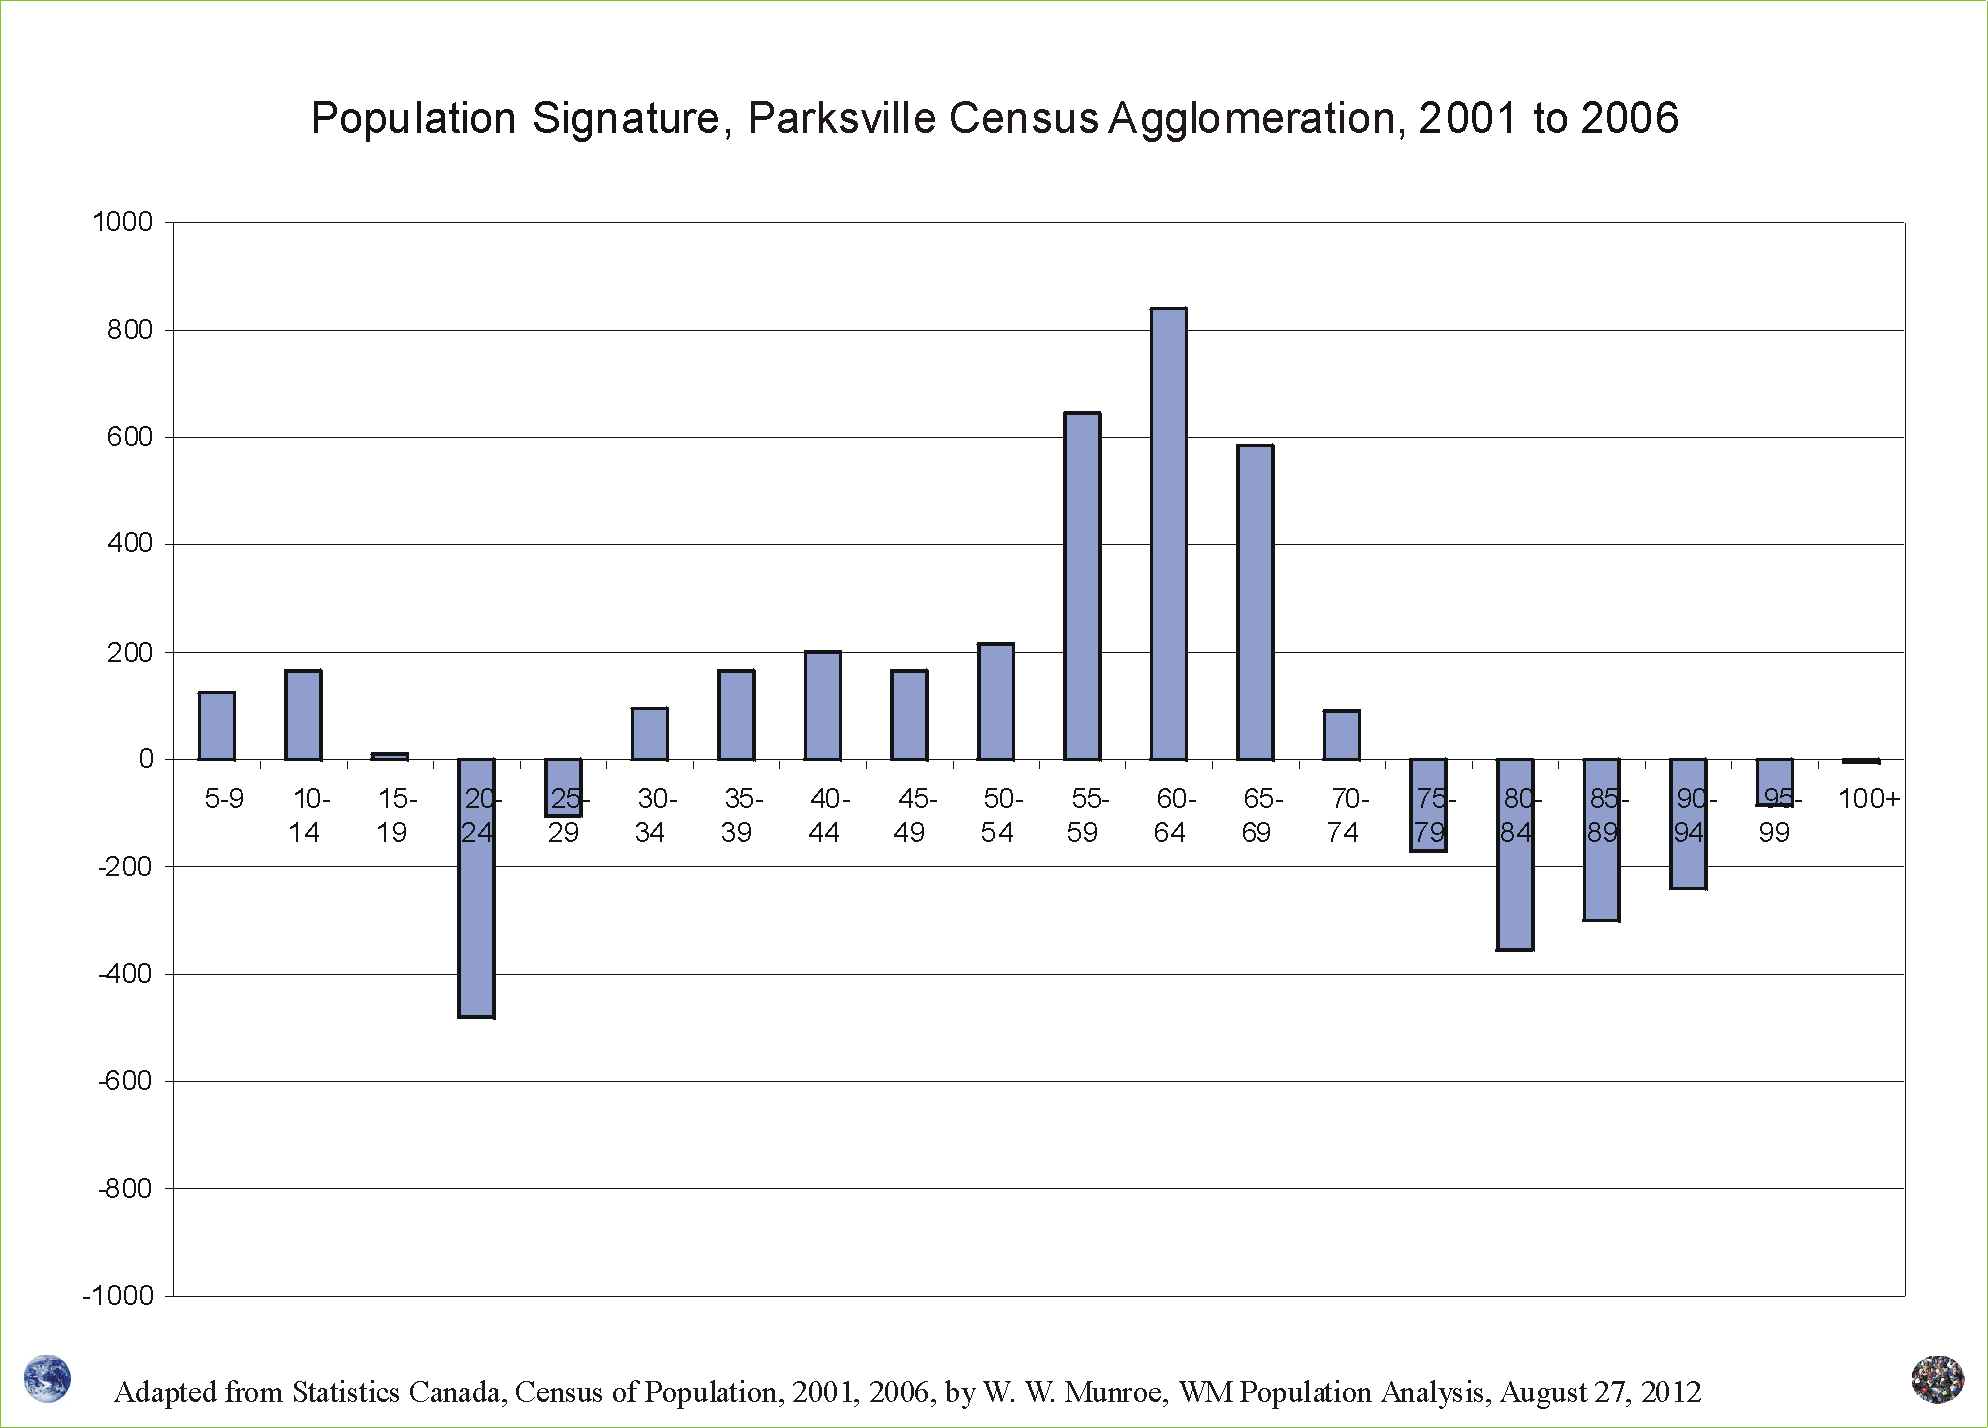
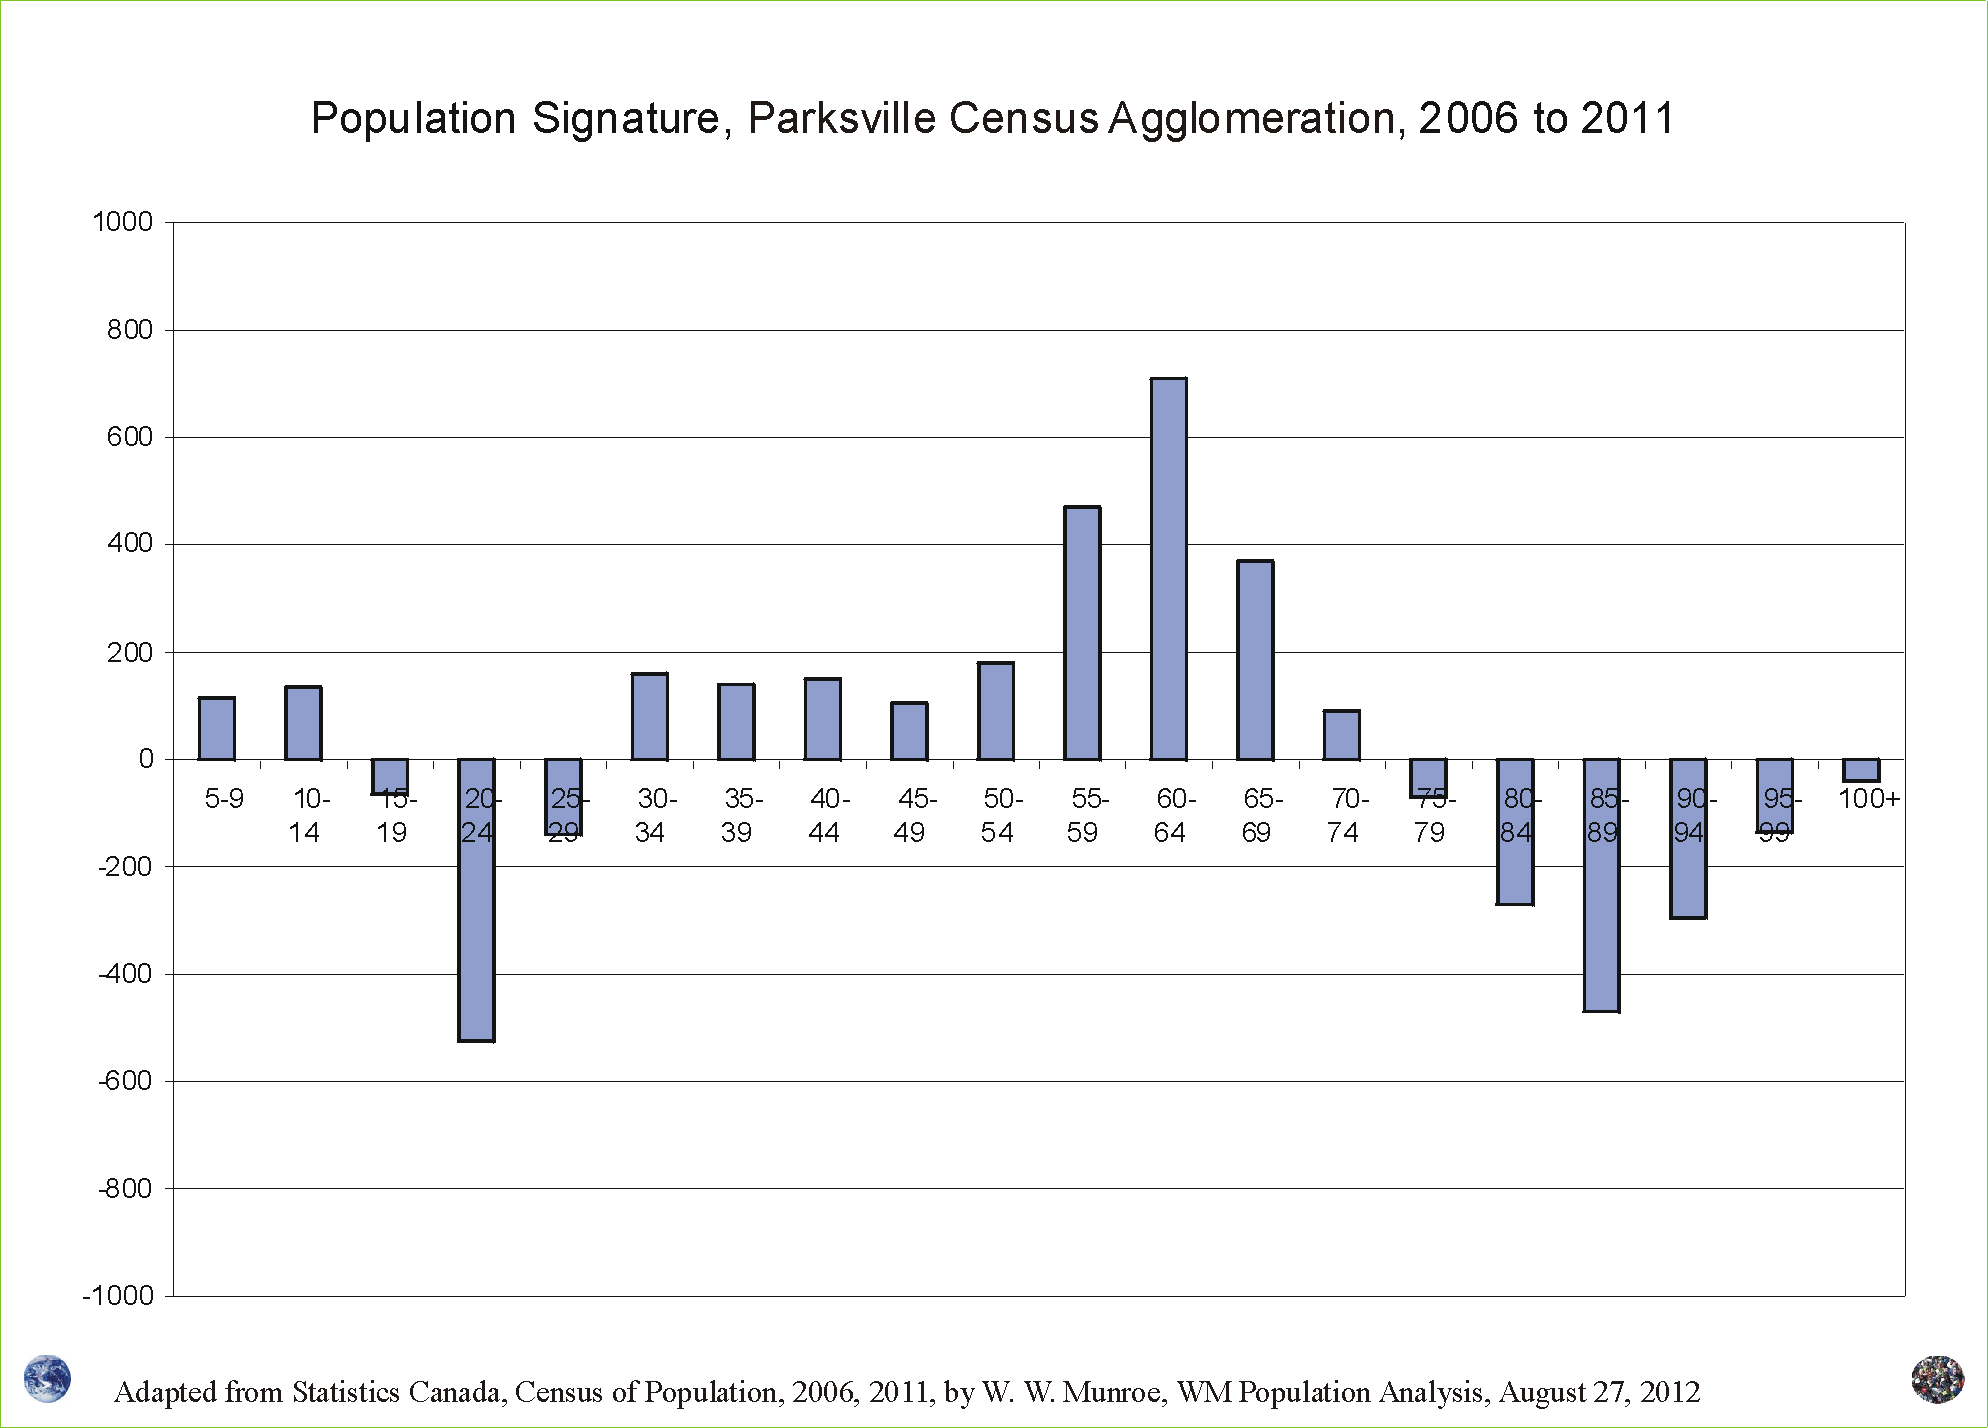
As with most of Vancouver Island and the Coast, Parksville Census Agglomeration provides an example of an area where the total population will likely decline as deaths and out-migration increasingly exceed births and in-migration.
While deaths continue to increase and births stay relatively low, below replacement, population can only increase with more in-migration than out-migration.
The area continues to be attractive, between 1996 to 2011, for both retirees and for families (5 to 17 and 30 to 50 year olds), while young adults (20 to 29 year olds) set speeding records to leave. Even so, migration varies in relation to economic cycles. Scroll over Figure 1 to see the difference between 2001 to 2006, and 2006 to 2011.
See the Population Signatures between 1996 to 2001 and between 2001 to 2006.
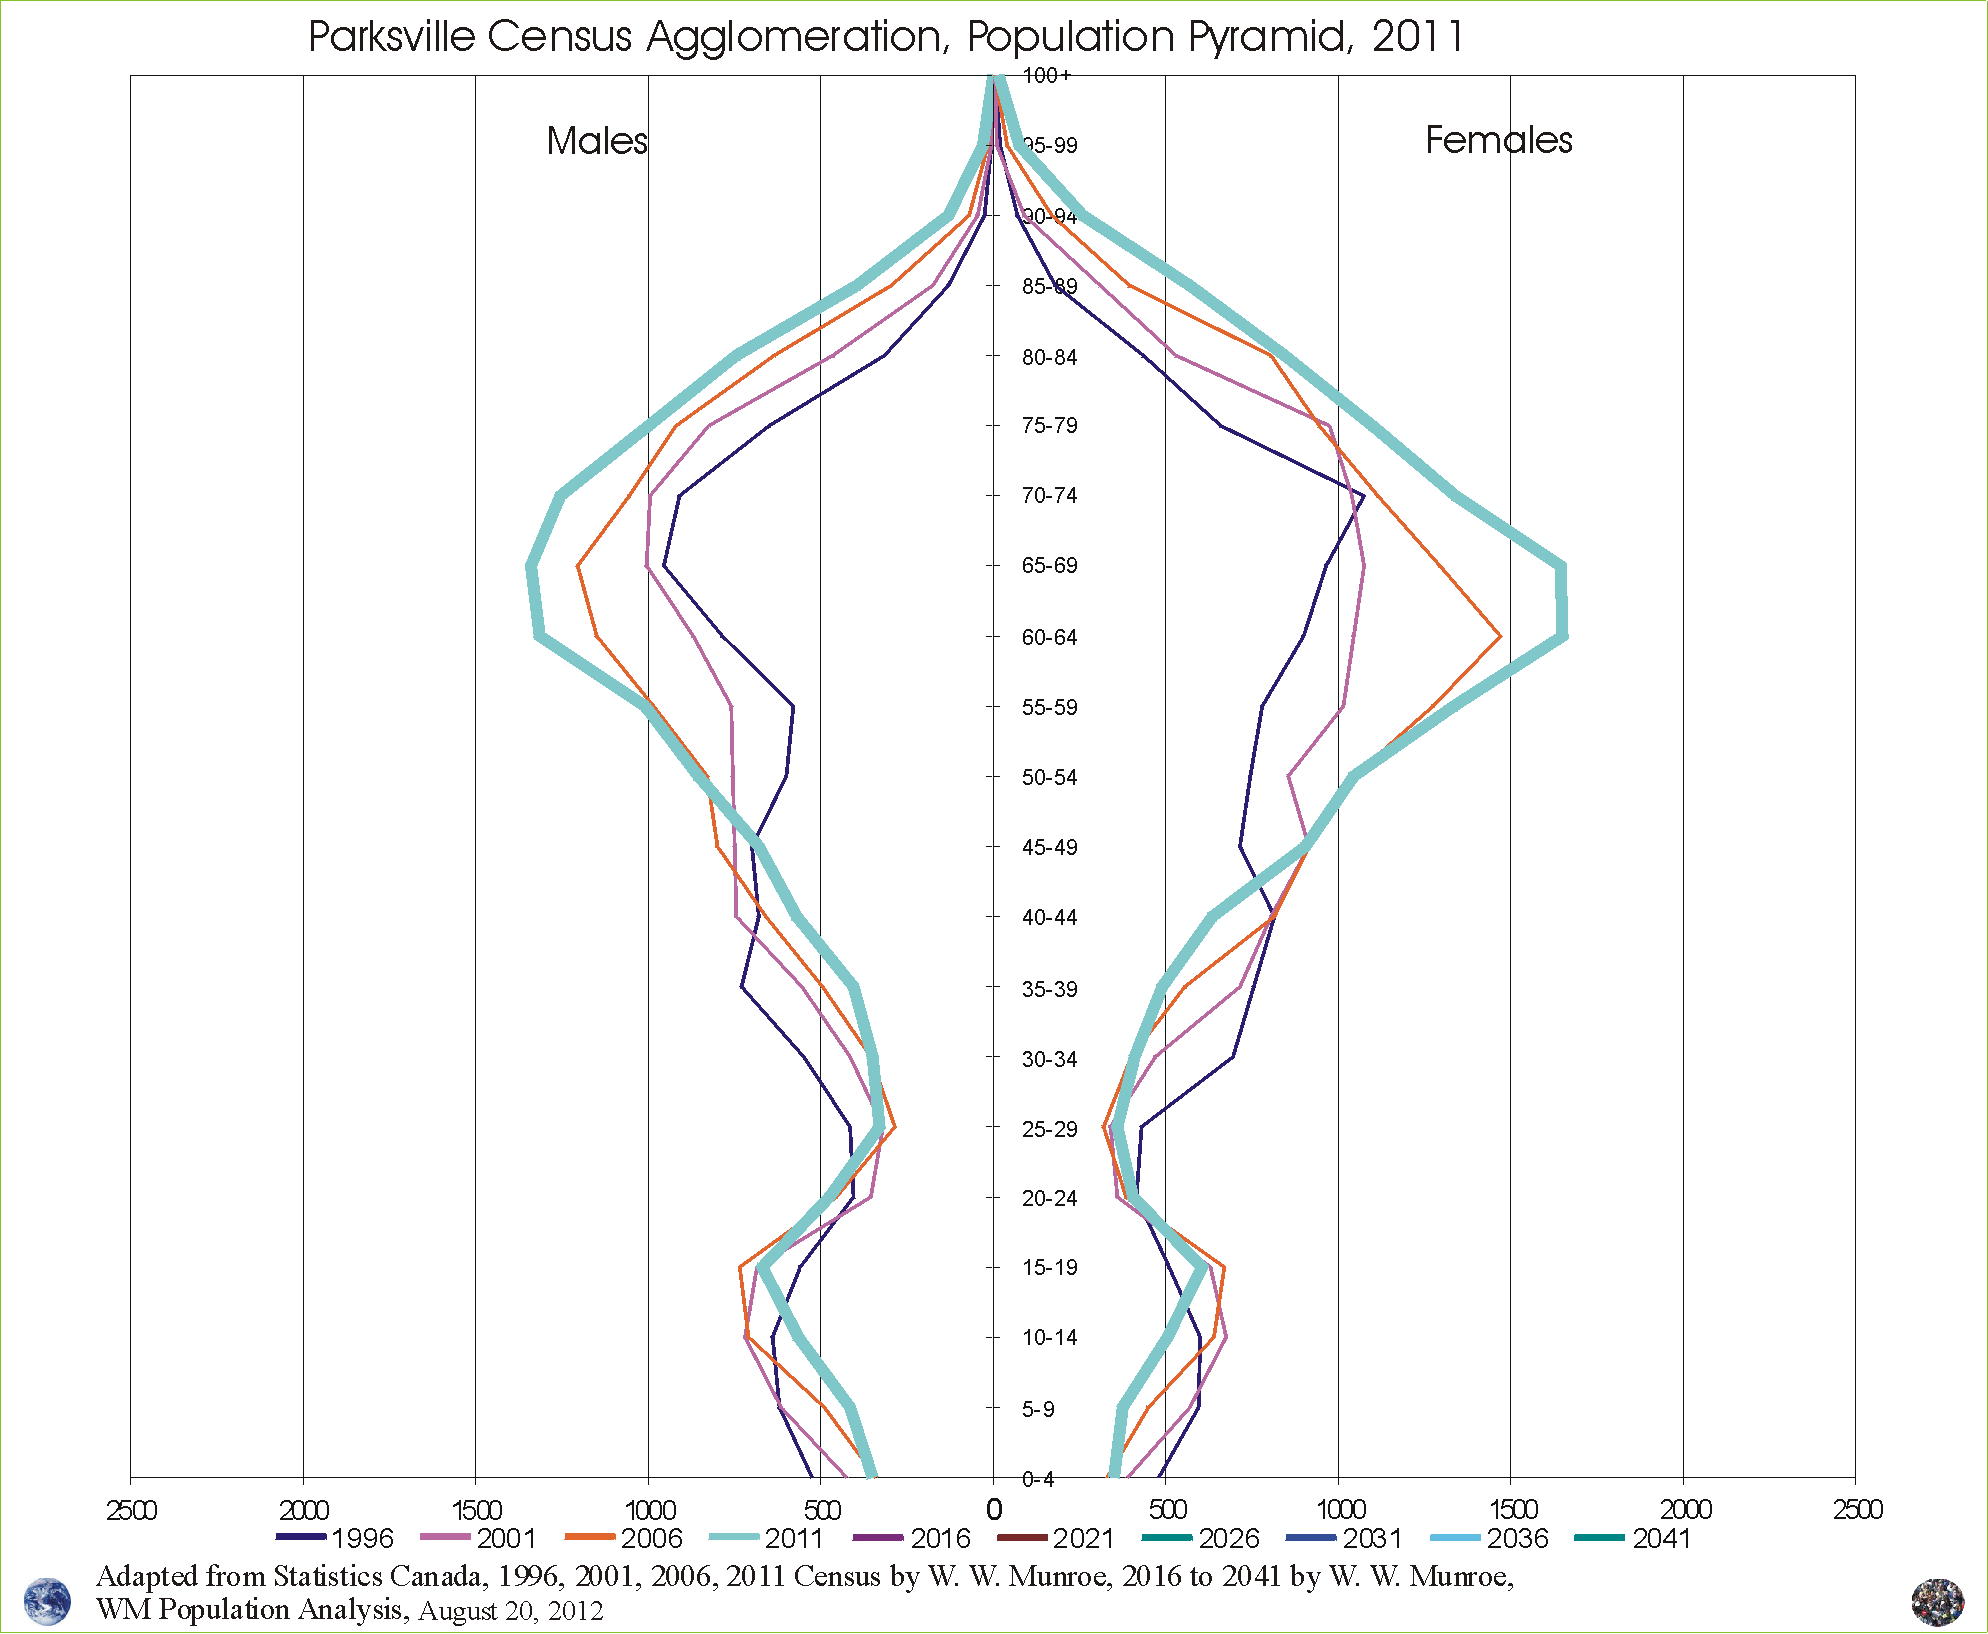
Since 1996, the median age has continued to rise moving ever closer to the high mortality years 70 plus. What will the age / sex distribution look like in the future?
Figure 2 shows the age / sex distribution from the census counts from 1996 to 2011. Notice the lose of adults of working age as they age out of the work force and are not replaced, at least not fully, by in-migration of those 30 to 50 years of age. The number of children 0 to 4 years of age is dependent on the number of females 20 to 39 years of age; therefore, the marginal increase, between 2006 and 2011, in the later is reflected in the marginal increase of the former.
With the high out-migration of the 20 to 29 year olds and the relatively low number of in-migrants of the 30 to 39 year olds, unless more females move to, and/or stay in, Parksville Census Agglomeration, or fertility rates increase, the number of children will likely remain low.
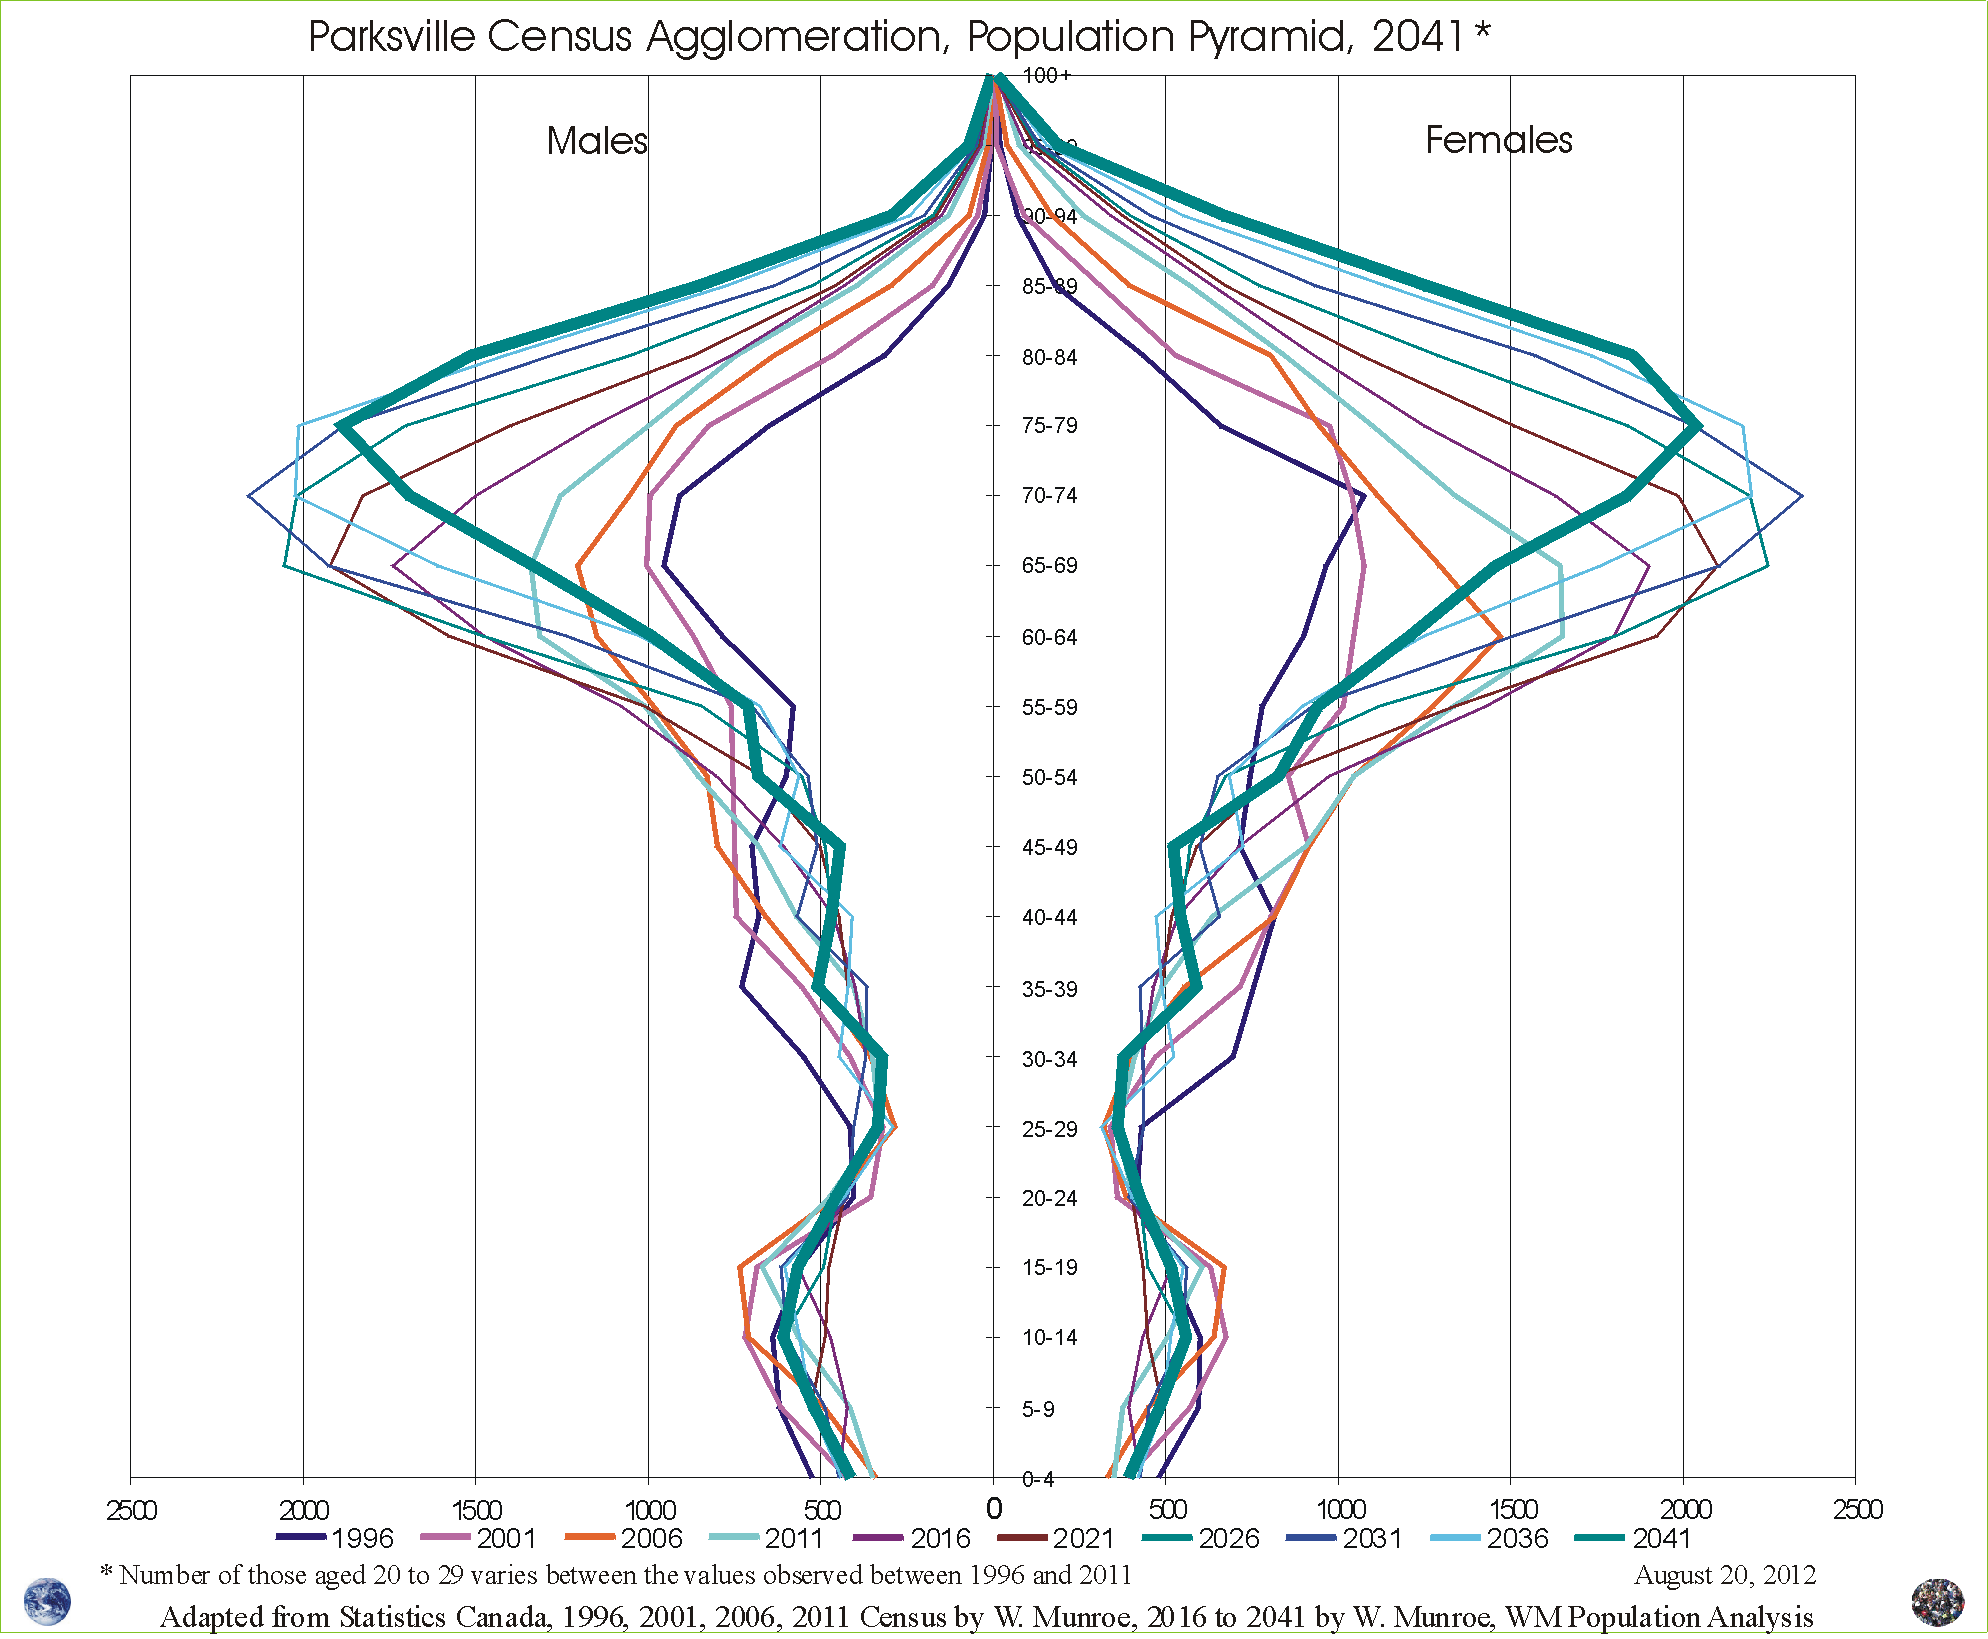
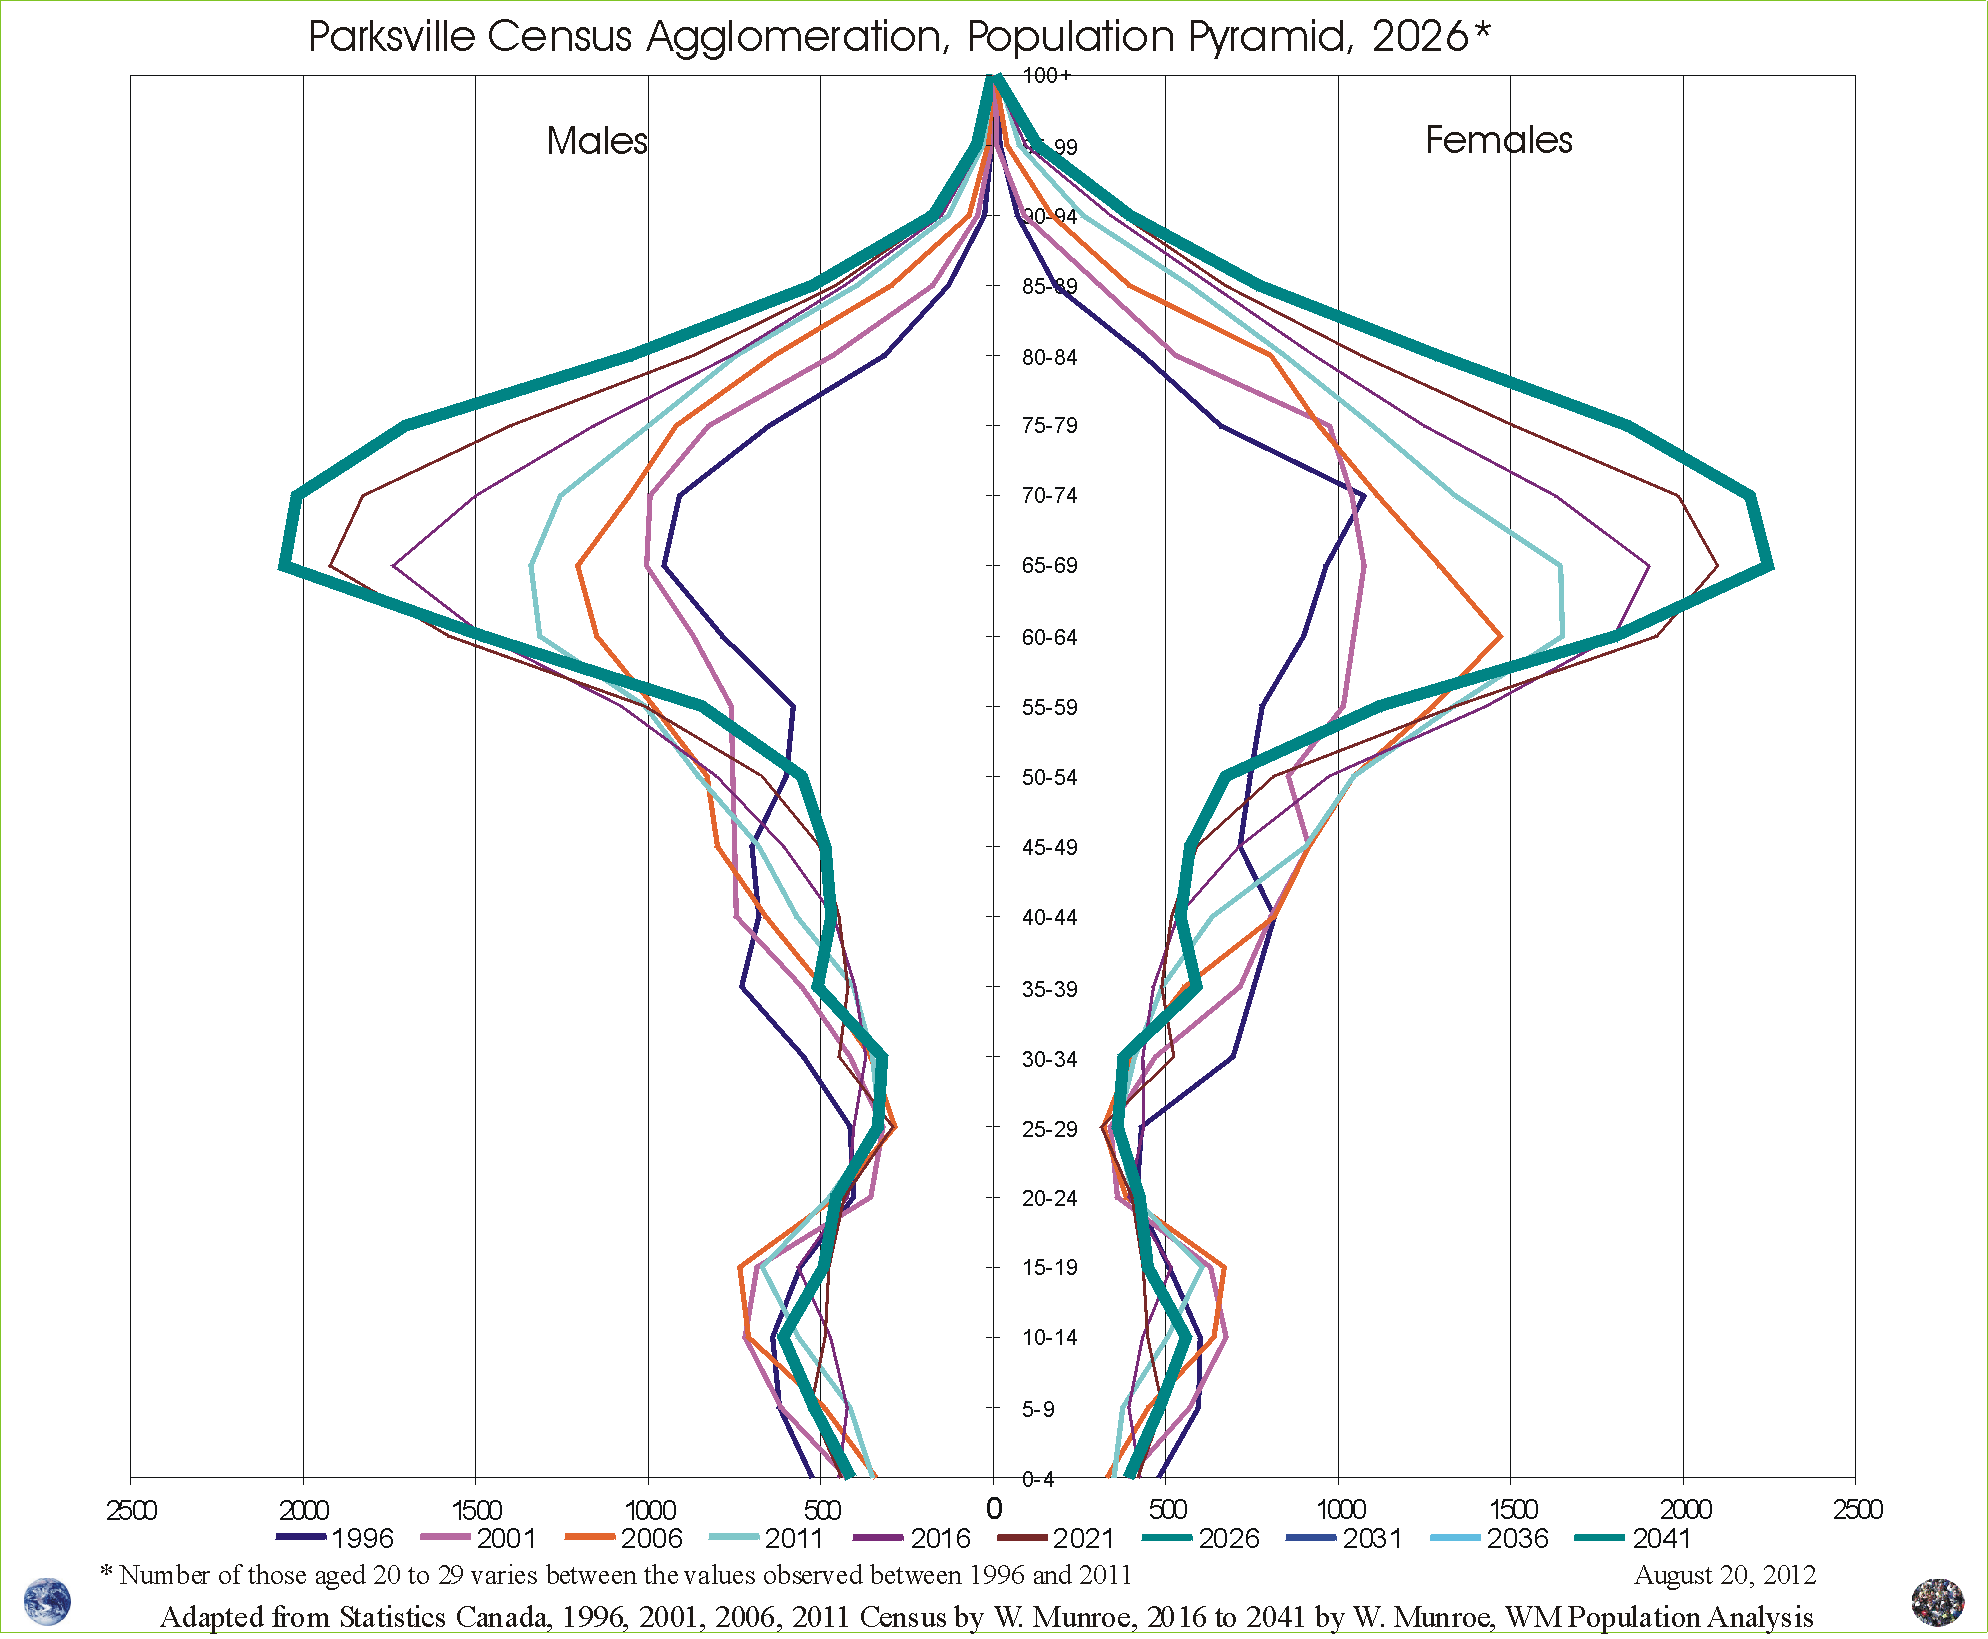
When creating these projections (Figure 3 and 4), an assumption is made that the number of those aged 20 to 29 will not drop below the absolute numbers seen between 1996 to 2011.
This variant assumes that the region can provide enough social and economic activity to accommodate a minimum number of young adults.
But what if we remove the assumption that the number of young adults will stay at levels seen between 1996 and 2011. Also, what of removing the assumption that imposes an average between these years on the future, by inviting in variation in the form of changes in migration as was seen between these years? The table in Figure 5 shows the Dependency Ratios for a projection that assumes economic cycles will likely continue into the future and also allows the young adults to run free (some have told me that they would run pretty fast too).

As can be seen in the table, the number of young adults to stay in and come to the area has a substantial ... noticeable ... very real impact on the future population.
It is interesting to consider the possibility that as single family dwellings may be in less demand, the prices may be relatively low, thus possibly attracting more families in the future.
1 Source: Adapted from the 1996 to 2011 census counts are from numeric tables from Statistics Canada found online via http://www12.statcan.ca/census-recensement/index-eng.cfm by W. W. Munroe
2 3 4 5 Source: Adapted from the 1996 to 2011 census counts from numeric tables from Statistics Canada found online via http://www12.statcan.ca/census-recensement/index-eng.cfm with projections, 2016 to 2041, by W. W. Munroe
Thank you to DAVE BRYAN for sponsoring the population analysis, with projections, for Parksville Census Agglomeration and Qualicum Beach. Dave's vision and foresight are an example of what it takes to make informed decisions.
For more information about population change, including impacts due to economic cycles, or changes in transportation (e.g. BC Ferry fees continue to rise while ridership declines impacting migration to Vancouver Island ) send an email to wmpopulationanalysis@shaw.ca.
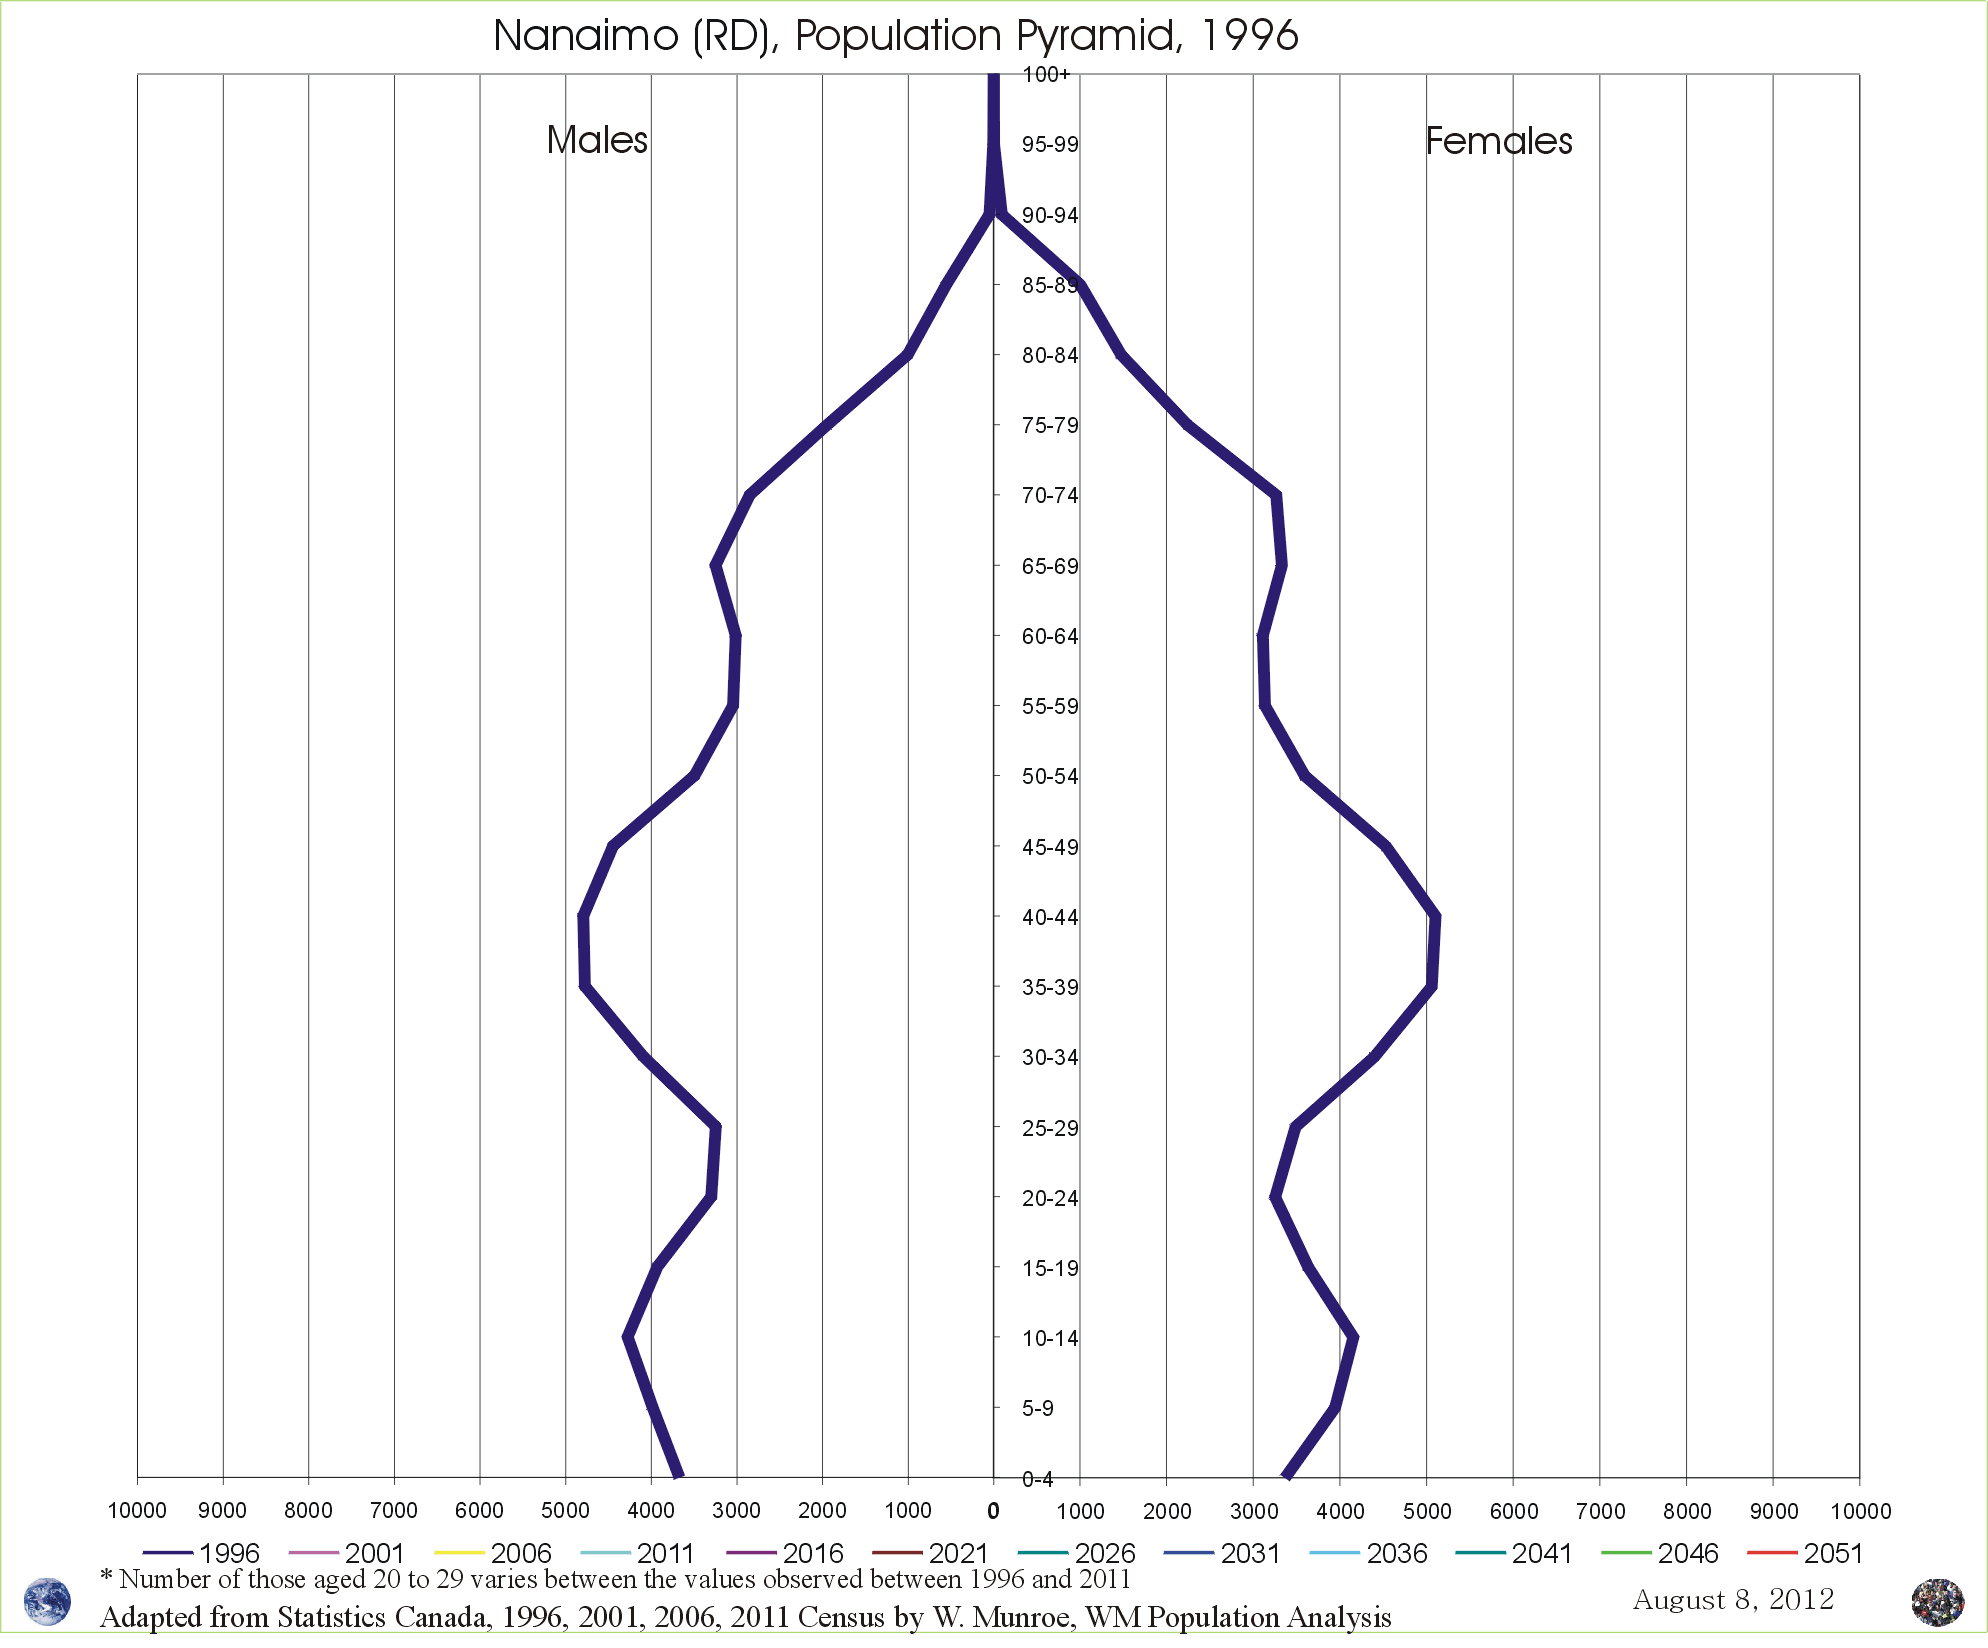
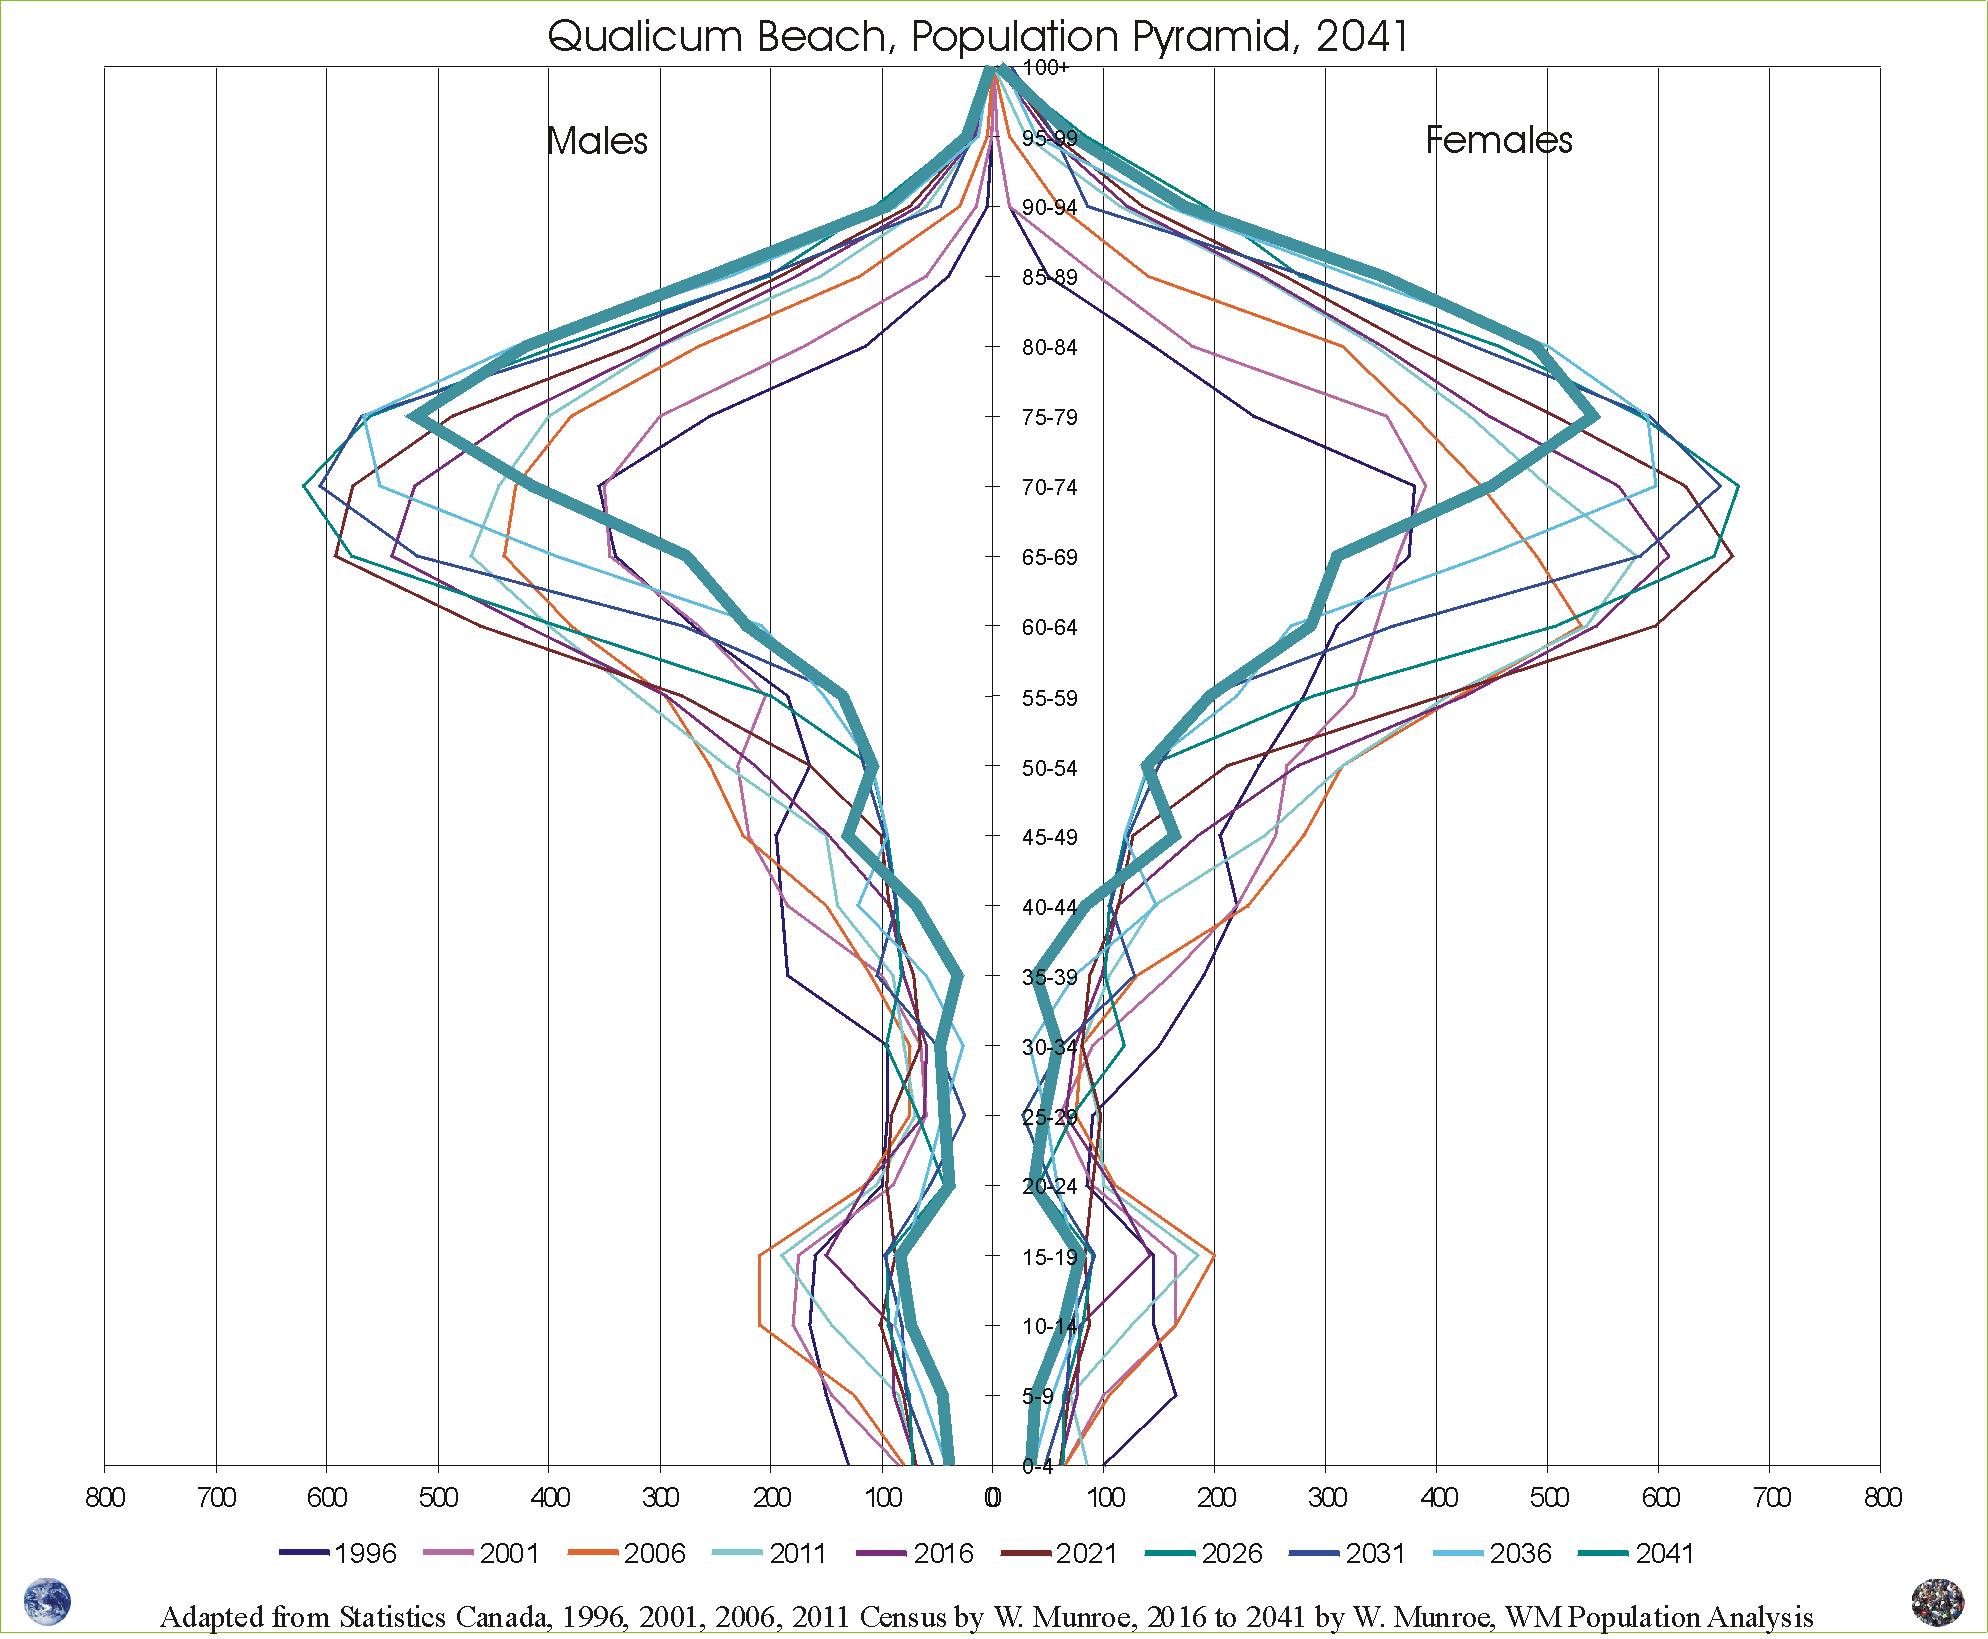
With deaths exceeding births by nearly 6 times (600%) and rising, will the fluctuating migration keep the town's total population from declining?
Read more ...