The following is a comparison of the population projections: 1) the United Nations, 2) Statistics Canada, and 3) using cohort change ratios.

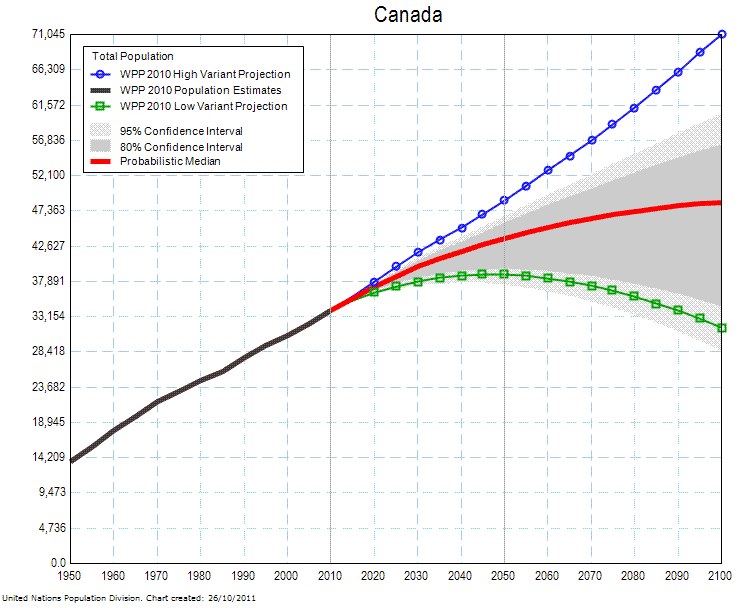
Source: United Nations, Department of Economic and Social Affairs, Population Division (2010): Population projections using probabilistic projections of total fertility and life expectancy at birth, based on a Bayesian Hierarchical Model (BHM). New York (internal data set). See endnote #1.

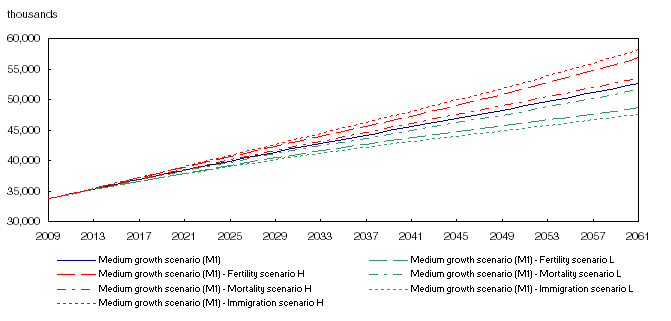
Source: Population Projections for Canada, Provinces and Territories 2009 to 2036 - Catalogue no. 91-520-X, http://www.statcan.gc.ca/pub/91-520-x/91-520-x2010001-eng.pdf. See endnote #2.

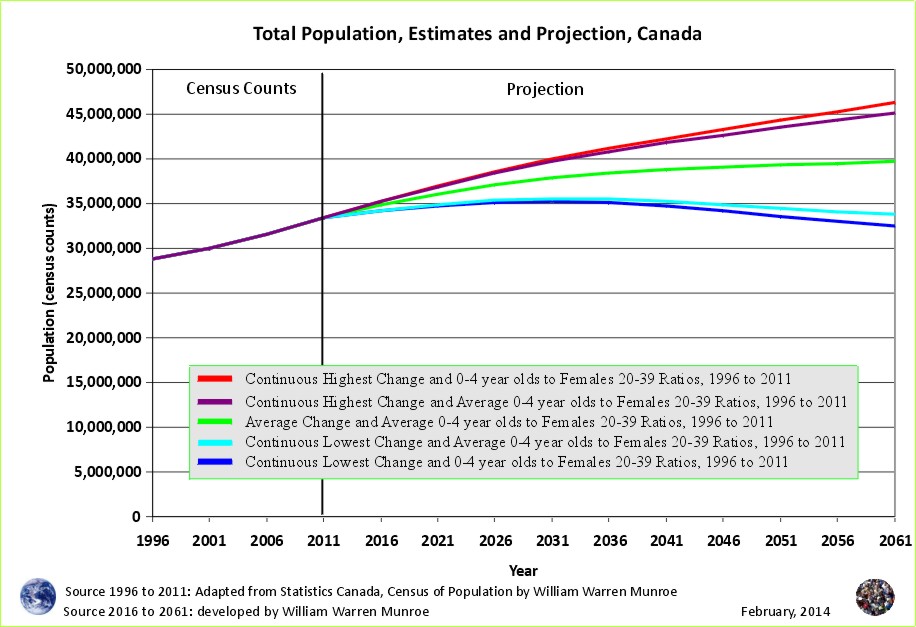
Source: The 2016 to 2041 projections are created by Warren Munroe using cohort change ratios with reference to the 1996 to 2011 census counts from Statistics Canada (STC). See endnote #3.
A comparison of the population projections shows similarities between the United Nations and the cohort change ratios method.
The UN medium - "probabilistic mean" - projects Canada's population to be approximately 45 million by 2061.
The cohort change ratios medium scenario, based on changes seen between the census years from 1996 to 2011 (see "Notes to the Reader" below), projects a population of approximately 40 million people by 2061. The cohort change ratios projection fits between the UN's low variant and medium projections, and within the 80% confidence interval.
STC's medium scenario suggests Canada's population will increase to over 50 million by 2061, just on the high side of the 95% confidence interval (Figure 1). STC low scenario suggests a population of over 45 million. This projection was developed prior to the 2011 census count release.
Endnotes
#1 United Nation Explanation: "These charts show estimates and projections of the total population for 197 countries and areas with a population of 100,000 or more in 2010. The projections are based on the probabilistic fertility projections from the 2010 Revision of the World Population Prospects. These probabilistic projections of total fertility had been carried out with a Bayesian Hierarchical Model. The figures display the high, medium and low variant of the 2010 Revision of the World Population Prospects, as well as the probabilistic median and the 95 as well as 80 percent confidence intervals of the projections. It should be noted that there can be a slight difference between the median of these experimental probabilistic population projections and the medium variant of the official 2010 Revision of the World Population Prospects. This is due to the fact that the population projections displayed here were carried out with a random sub-sample of 5,000 probabilistic fertility trajectories from the original 100,000 trajectories of total fertility used in the 2010 Revision."
See http://esa.un.org/unpd/wpp/P-WPP/htm/PWPP_Total-Population.htm
#2 Statistics Canada Statement "It is also worth noting that the accuracy of any projection is conditional on the reliability of the base population estimates, the component data, and the degree to which the underlying assumptions correspond to future trends. Projections are not predictions; they are instead an effort to create plausible scenarios based on assumptions regarding the components of population growth, which are themselves subject to uncertainty. Accordingly, it cannot be claimed that the values observed in the coming years will always remain within the range implied by the low-growth and high-growth scenarios."
#3 Warren Munroe’s Population Analysis Qualification: The 2016 to 2041 projections are created using cohort change ratios with reference to the 1996 to 2011 census counts from Statistics Canada.
Source: the 1996 to 2011 census counts are available from Statistics Canada athttp://www12.statcan.ca/census-recensement/index-eng.cfm.
NOTE TO THE READER:
This article is a revision of the October 2012 comparison, with the addition of two more scenarios using the cohort change ratios.
Acknowledgements go out to David A. Swanson, PhD, (University of California, Riverside) for having written "Using cohort change ratios to estimate life expectancy in populations with negligible migration: A new approach" (Swanson and Tedrow, 2012, Canadian Population Society publication) and for sending the methods paper "Forecasting the Population of Census Tracts by Age and Sex: An Example of the Hamilton-Perry Method in Action " (David A. Swanson, Alan Schlottmann, Bob Schmidt 2009).
These and other readings show that variants of the cohort change ratios method have been used for many years and continues to be refined. Referring to a 2002 report from the UN, Dr. Swansen et al., (2012) state "we prefer to use the more general term "cohort change ratios" (CCRs)."