What does the shift from child to elderly dependency relative to those of working age look like?
December 30, 2013, the Globe and Mail ran an article entitled "An Aging Population: Our Senior Moment" by Dr. John MacInnes and Dr. John Spijker from the University of Edinburgh, addressing
and the changing age distribution as fewer children are replaced by more elders.
Canadians have arguably the best data set with which to examine the changing age distribution, namely the Census of Population conducted every five years. Referring to the 1996, 2001, 2006, and 2011 census counts 2age sex distribution projections (by five year age groups) can be created3.
Let's look at the impact on dependency ratios comparing two age groupings: 20 to 64 versus 20 to 69 years of age, recognizing prolonged youth training (starting 'working age' at 20 instead of 15) comparing shifts in retirement age (ending 'working age' at 69 instead of 64).

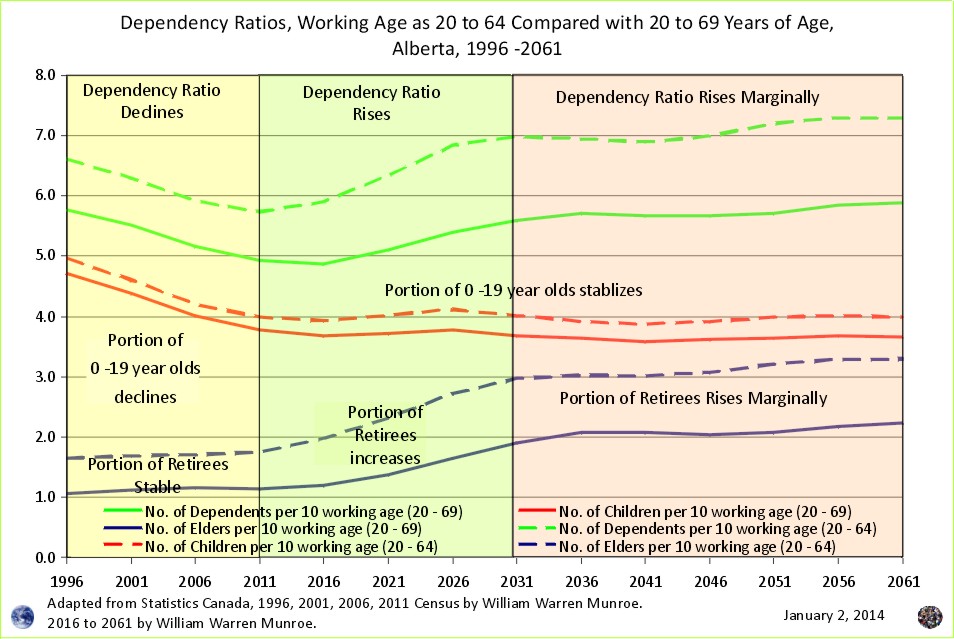
For this study, it would be helpful to examine several areas: Canada as a whole, as well as a couple / few provinces territories. As it turns out Alberta is the first area to be scrutinized (starts with an A). Figure 1 shows dependency falling roughly into three phases:
1) Declining Dependency: 1996 to roughly 2011; followed by
2) Rising Dependency: 2011 to 2031, followed by,
3) Stable (Rising Marginally) Dependency: 2031 to 2061 - an outcome of below replacement fertility.
Also, while the dependency ratios for those 20 to 64 compared to those 20 to 69 differ in magnitude (the later naturally lowering dependency, and staying lower longer) they both move in a similar manner. Interestingly, for Alberta, the dependency ratio, using 20 to 69 years of age as working age, resumes levels seen in 1996 after a dip bottoming out in 2011.
Of course dependency varies by place. Alberta is unusual in Canada in that it is so attractive to young adults moving in from other parts of the country. Also the projection is suspect as it assumes that the high positive net interprovical migration will continue for 50 years to 2061, whereas a forecast taking into consideration limits to growth (i.e. oil and gas limits) as well as booms and busts would show a very different future population makeup (easy enough to create). Perhaps human geographers at U of Alberta and or U of Calgary would be interested in creating these?
Some areas such as British Columbia and in particular the Nanaimo Regional District have much higher proportions of elderly with dependency ratios for Canada's oldest municipality (in terms of median age) reaching as high as 20 dependents to 10 people of working age.
More discussion and open dialogue addressing changes in age distribution will help improve population related policy-making, including opening and closing facilities, changes to municipal Official Community Plans, etc.
Thank you to Dr. John MacInnes and Dr. John Spijker and the Globe and Mail for raising awareness and promoting discussion about age distribution and population change. I would like to add a thank you to Dr. Jochen Mayer, also from the University of Edinburgh, for his support of sensible, verifiable population projections.
1 the Globe and Mail, "An Aging Population: Our Senior Moment" by Dr. John MacInnes and Dr. John Spijker from the University of Edinburgh, December 30, 2013, http://www.theglobeandmail.com/globe-debate/an-aging-population-our-seniors-moment/article16124606/
2 Adapted from Statistics Canada, 1996, 2001, 2006, and 2011 Census of Population, by William Warren Munroe
1996 Census: Catalogue Number 95F0181XDB96001.
2001 Census: Catalogue Number 97-551-XCB2006009. (this is the source provided with the download for Alberta for 2001 Age Sex census counts which is the same as the 2006 Catalogue Number)
2006 Census: Catalogue Number 97-551-XCB2006009.
2011 Census: Catalogue Number 98-311-XCB2011024.
1996 is the starting point because this was when readily available data became available on the internet in a form comparable to later years, providing an understanding of recent trends.
3 For more information on how to create population projections see the Population Projection Project.