
Many people have been asking how I (and many many others including some social scientists1) figured out (when in 2008, I informed Superintendent of Schools for the Qualicum School District) about the coming increase in elementary school enrolment. Indeed, the enrolment in elementary schools in the QSD rose in 2013. Is this increase a blip - a short upturn during a longer downturn due to below replacement fertility? What's going on?
In the July 1, 2014 article, we saw the census counts and projection (medium scenario) for those under 5 years of age within Canada. Since those 0 to 4 years of age counted in 2011 was considerably higher than those in this age group counted in 2006, we should see the number of those 5 to 9 years of age, (Kindergarten to Grade 4) increase between 2011 and 2016. Let's take a look at BC's census counts and projection (medium scenario).
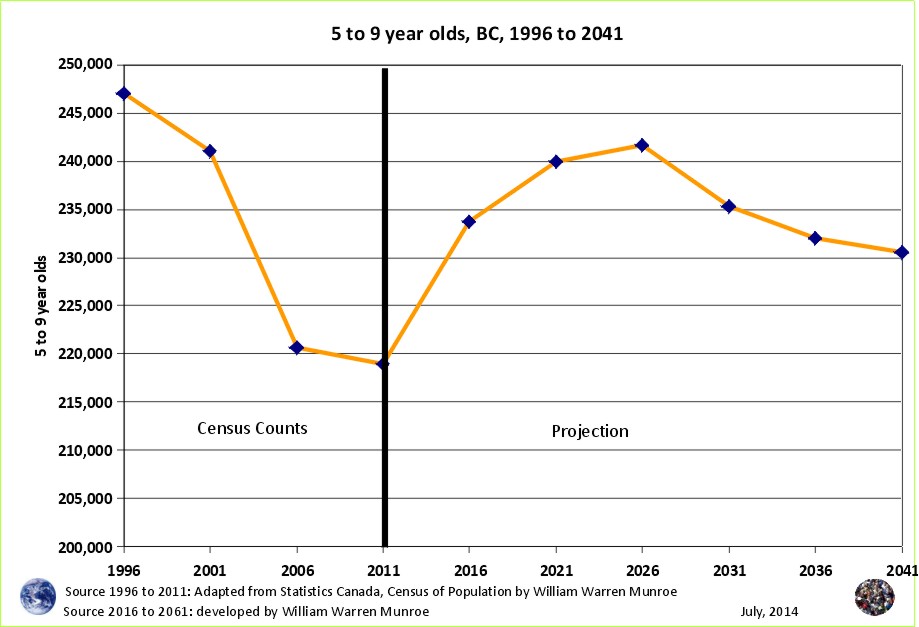
What are the numbers? According to the census counts, in BC, the number of 0 to 4 year olds increased by 17,785 between 2006 (201,885) and 2011 (219,670) while the number of 5 to 9s declined marginally by -1,780 between 2006 (220,700) and 2011 (218,920); however, the projection (medium scenario) shows an increase of 14,810 5 to 9 year olds by 2016 (233,730 - while births have increased, BC is also attractive to families)3.
What does this mean for schools? The increase of over 14,810 5 to 9 year old children with let's say 20 per class, means there should be approximately 740 more classes and teachers needed over the 5 year period from 2011 to 2016. 740 divided by 5 years gives us a very rough average approximation of 150 additional elementary school classes and teachers per year province wide. Of course some young children will be home schooled, but nonetheless, resources will needed to meet the welcomed increase in the number of children.
Of course there is considerable variation in the change in the number of those 0 to 4 years of age between 2006 and 2011 between areas within BC. For example, some towns show a very small increase in the children under 5 years of age between 2006 and 2011; however, if the same small towns are attractive to families with young children moving from high density areas, we may see that the large increases in under 5 year olds in high density areas result in an increase in in-migration of young children and their parents/guardians to surrounding, outlaying, back home for some, communities.
The 2006 census showed most in-migrants to the Nanaimo Regional District came from the GVRD and the Capital RD. We have seen in previous articles that more young families move out of these core areas than in, while more young families move into the Nanaimo RD and particularly the Qualicum area than move out. This should be interesting to watch for in the 2016 census.
Since enrolment has been declining since the end of the 20th century, should we be closing elementary schools? The MLA for the Parksville Qualicum area explained public school closures are due to declining enrolment. 2 elementary schools in the Qualicum school district will be closed this fall. Funny how some high schools are opened or expanded when the enrolment goes down, and elementary schools are closed when enrolment rises again.
Should elementary schools be closed?
What do you think?
1 Many many others including some social scientists, figured out / could see in the age distribution tables od discovery - census tables -about Boom, bust, and echo. .
2 The figures for 1996, 2001, 2006, and 2011 are adapted from Statistics Canada, 1996, 2001, 2006, and 2011 Census of Population counts, by William Warren Munroe. The projections (2016 plus) are developed referring to the 1996, 2001, 2006, and 2011 census counts using the cohort change ratios method.
Statistics Canada. 2012. Population and dwelling counts, for Canada, provinces and territories, 2011 and 2006 censuses (table). Population and Dwelling Count Highlight Tables. 2011 Census. Statistics Canada Catalogue no. 98-310-XWE2011002. Released February 8, 2012. http://www12.statcan.ca/census-recensement/2011/dp-pd/hlt-fst/pd-pl/File.cfm?T=101&SR=1&RPP=25&PR=0&CMA=0&S=50&O=A&LANG=Eng&OFT=CSV (accessed February 08, 2012). For further information, refer to: http://www12.statcan.gc.ca/census-recensement/2011/dp-pd/hlt-fst/pd-pl/Notes-eng.cfm.
3See the write up of the 2008 Global to Local Population Change presentation to the local Chamber of Commerce.
Population Projection Project for Canada's Census Areas
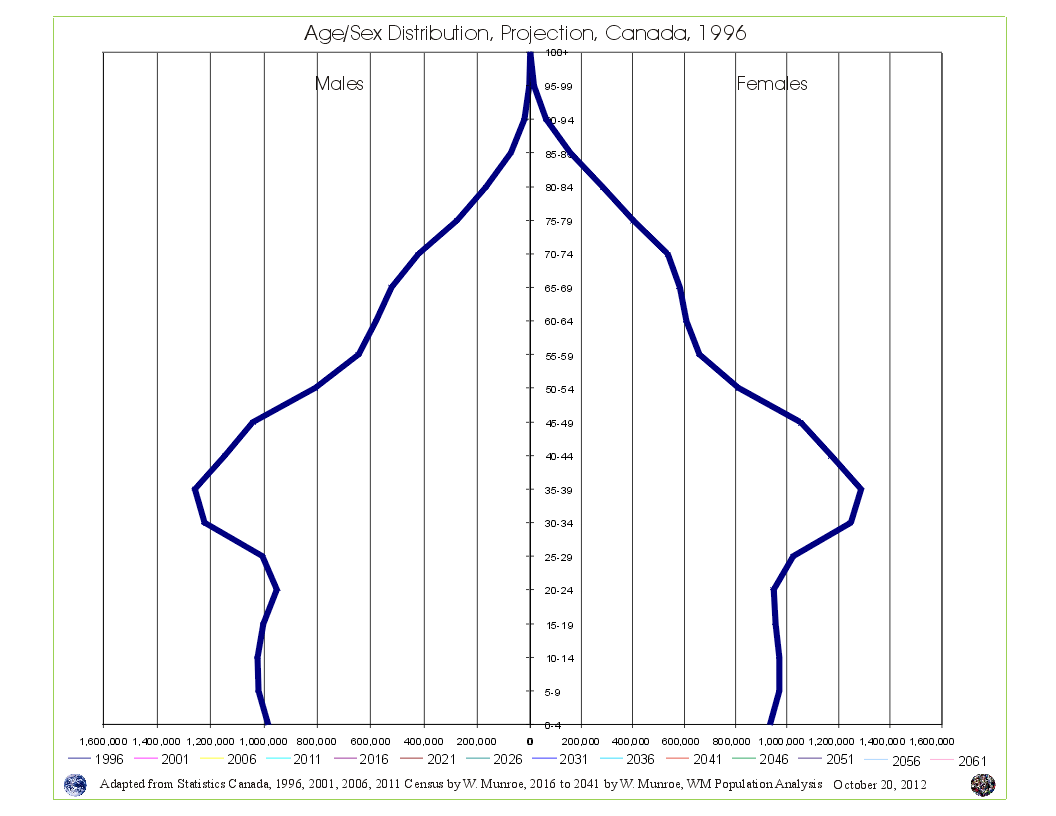 Take a look at Canada's Age Sex Distribution animated projection (medium scenario). The animation starts at 1996 and clicks through to 2041. Notice in the 1996 chart, the baby boom bulge (which is just the resumption of more births than deaths - the population pyramid - after WW2) followed by fewer numbers in the younger age groups reflecting (resulting from) reduced fertility beginning in the mid 1960s. This medium scenario is an average of the 1996 to 2011 cohort change ratios thus creating a central tendency that eventually provides smooth lines in the younger age groups by the end of the projection period.
Why are Statistics Canada's projections so high compared to the United Nations and the Cohort Change Ratios projections?
Government population projections for BC reflect an "up and to the right" aspiration, while the cohort change ratios method shows BC's population growth slowing, and levelling out. Read a "A Comparison of Population Projections for BC"...