
The Population Projections Project calculates several population projections scenarios directly from Censuses of Population available over the last 20 years, from the nation as a whole to small towns and villages.
However, the counts are not entirely accurate, some people are missed and some counted more than once. Statistics Canada offers an estimate of the amount of error (aka an undercount) of approximately 2 to 3 % for Canada as a whole. Statistics Canada provides annual population 'estimates' - numbers based on the census counts but adjusted for the estimated undercount.
How do total population projections calculated directly from the counts using cohort change ratios (CCRs) compare with those calculated directly from the estimates also using CCRs? Let's take a look.
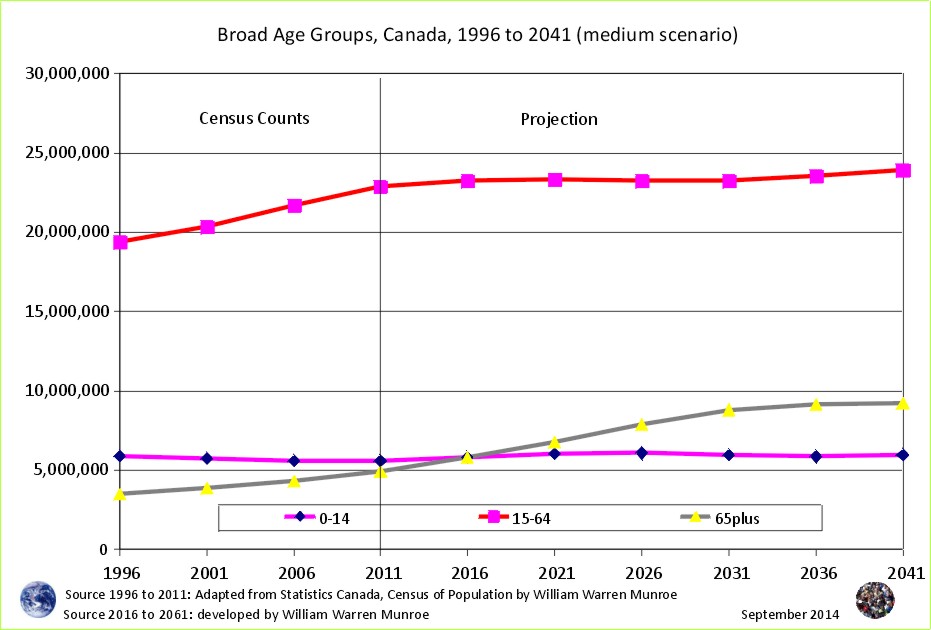
To do this, we'll use the census years since 1996 to calculate total population projections scenarios referring to counts (Figure 1) compared to scenarios referring to STC's estimates (Figure 2) for Canada as a whole. We understand right away that the counts will be lower in absolute numbers (by about 2 to 3%) than the estimates, but we want to see if there is much of a difference in the demographic trends.


The projections calculated directly from the Census of Population counts for Canada are marginally lower than the projections calculated directly from Statistics Canada's estimates but otherwise very similar.
The Population Projections Project does not over look nor by-pass the census counts, but rather starts with the census counts because they are raw, genuine and unadulterated. The estimates from Statistics Canada make sense and may be preferable to the counts; nonetheless the counts and the estimates create very similar demographic trends. One of the benefits of the Census of Population is that counts are available for small areas such as towns and villages. These come with an estimate of undercount.3
Let's not stop here though. In the next article we'll take a look at Dependency Ratios calculated referring to counts compared to estimates.
We look forward to the release of the 2016 census counts in 2017.
1 Adapted from the Census of Population counts (1996, 2001, 2006, and 2011, Statistics Canada); and projections (2016 to 2041) created by William Warren Munroe.
To download census counts go to: Statistics Canada's website at http://www12.statcan.ca/census-recensement/index-eng.cfm. Be sure to read the footnotes and check for important information about possible changes from one census to the next. These are counts; therefore, everyone may not be counted and sometimes people are counted more than once.
2 Go to Cansim online, Population Demography, Population estimates and projections, Estimates for Canada, provinces territories, 051-0001; Estimates to the census division level 051-0062.
3 Some areas within Canada have much higher error. Caution should be exercised when looking at small population areas as the error may make analysis less refined. I recommend looking at areas across scale, from Canada to the province or territory then to the Census Division (i.e. Region, Division, County etc.) then go to the CMA or CA then to the small population area such as cities, towns and villages and unorganized areas.
"Up and Down, Up and Down - Canada's Teeter Tottering Children Population"
Population Projection Project for Canada's Census Areas
Why are Statistics Canada's projections so high compared to the United Nations and the Cohort Change Ratios projections? Read "Compare projections for Canada - United Nations, Statistics Canada, Cohort Change Ratios".